The U.S. Securities and Exchange Commission (SEC) has approved the conversion of Grayscale’s Digital Large Cap Fund (GDLC) into a spot ETF. The GDLC includes XRP alongside Bitcoin, Ethereum, Cardano, and Solana. Although XRP has not received approval for its own ETF, this indirect inclusion signals progress for the token.
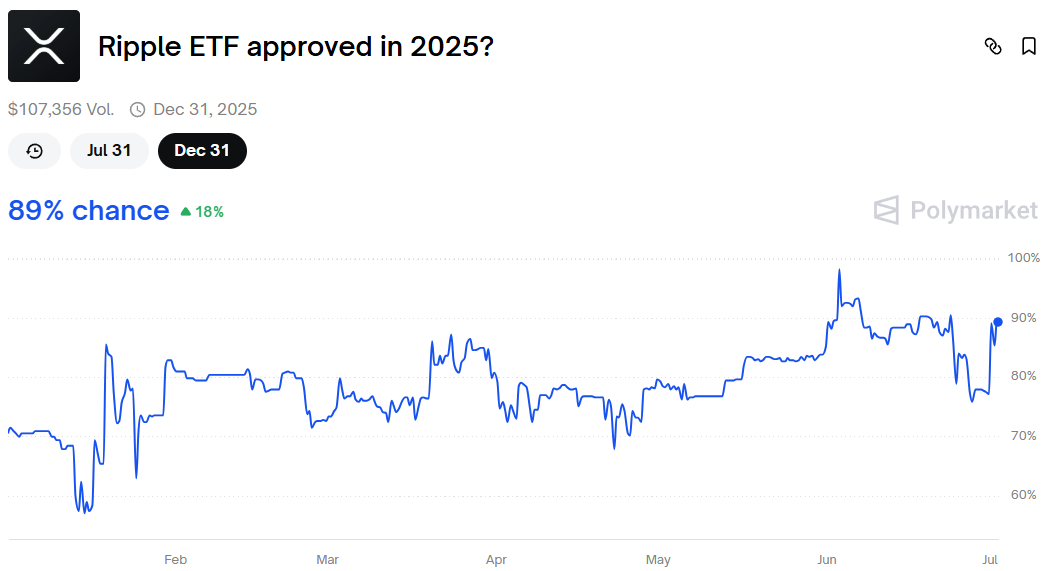
Earlier this year, hopes for a standalone XRP ETF gained traction. On Polymarket, approval odds climbed as high as 89%, driven by speculation and growing institutional interest. Many expected a decision by late July. However, the chances have recently dropped to 17%, showing a shift in sentiment.

XRP Price Volatile as Investors Flip Sentiment
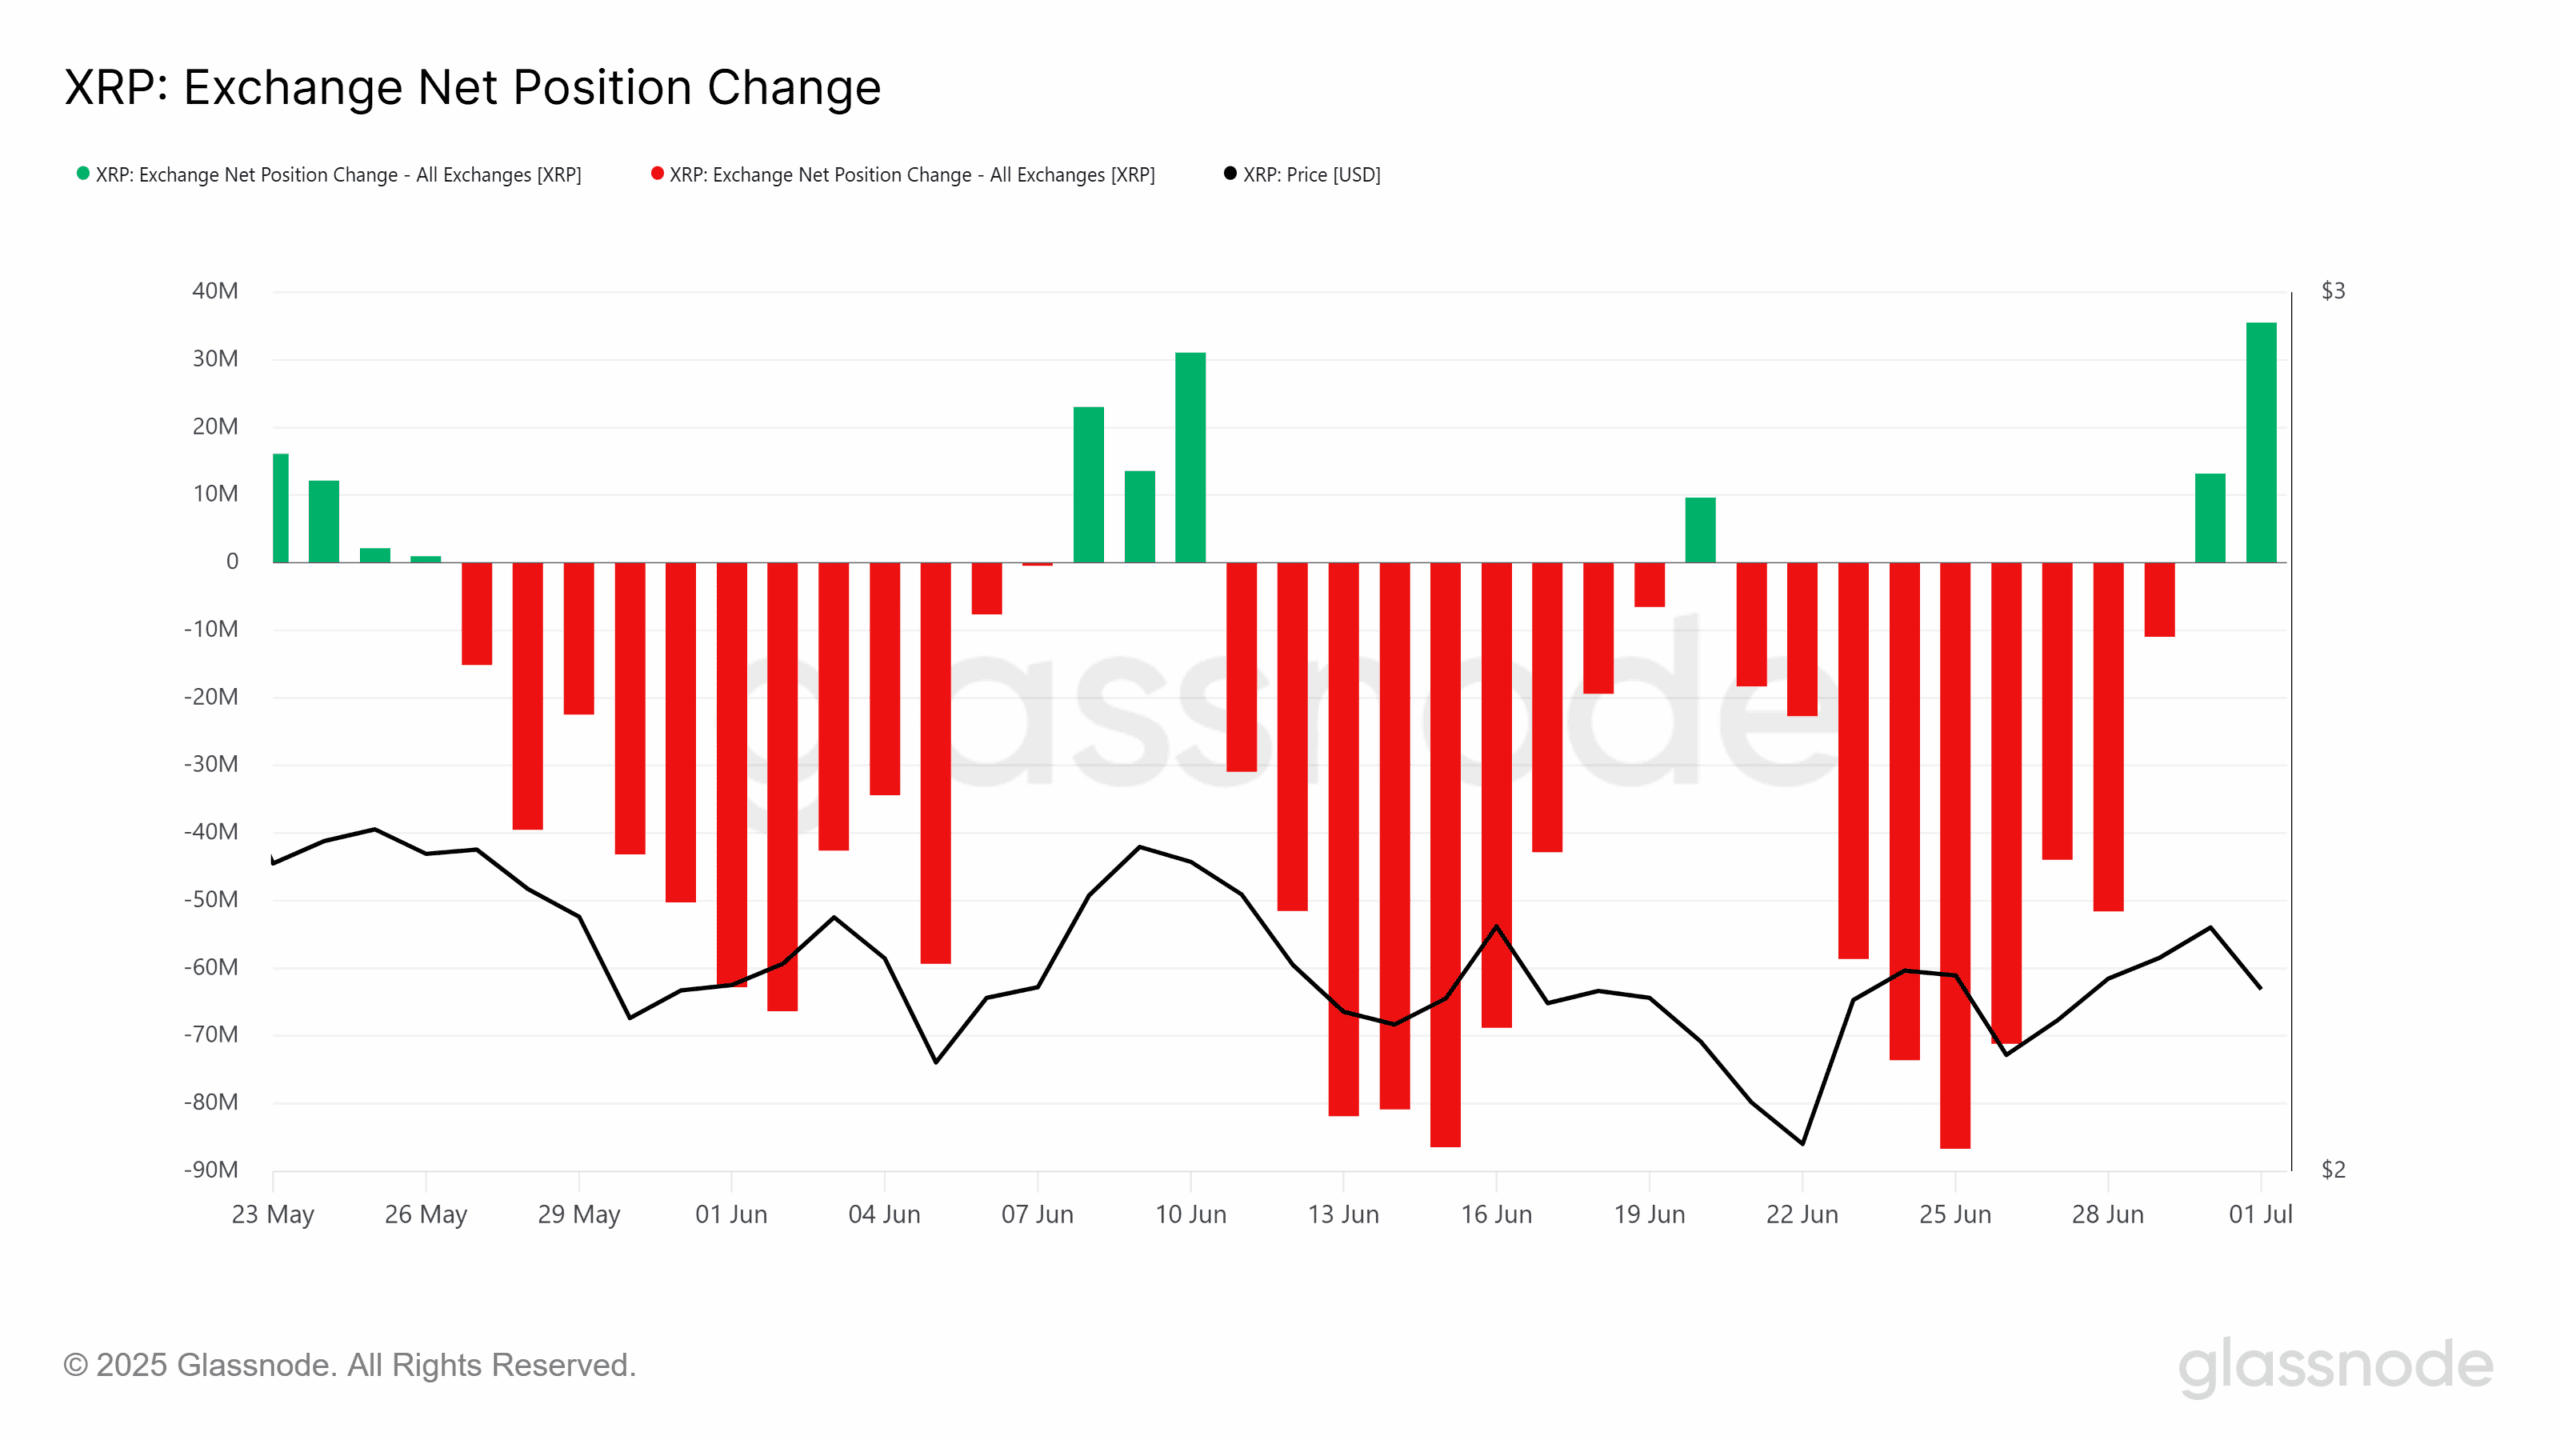
Meanwhile, XRP price performance continues to face pressure. On-chain data shows that net exchange position change frequently shifts between inflows and outflows. This pattern suggests uncertainty among investors.

Periods of accumulation do happen, but they often end quickly as selling resumes. This behavior has prevented sustained upward movement in price. Instead, XRP continues to respond to short-term investor sentiment and broader market volatility.
The SEC’s approval of GDLC as a spot ETF includes XRP exposure. However, it does not amount to direct approval of a standalone XRP ETF. Still, XRP’s presence in an SEC-approved fund adds to its institutional profile.
Until the SEC gives a green light to an XRP-only ETF, the token’s outlook remains tied to broader market behavior and investor activity on exchanges.
XRP Forms Bullish Flag on Daily Chart
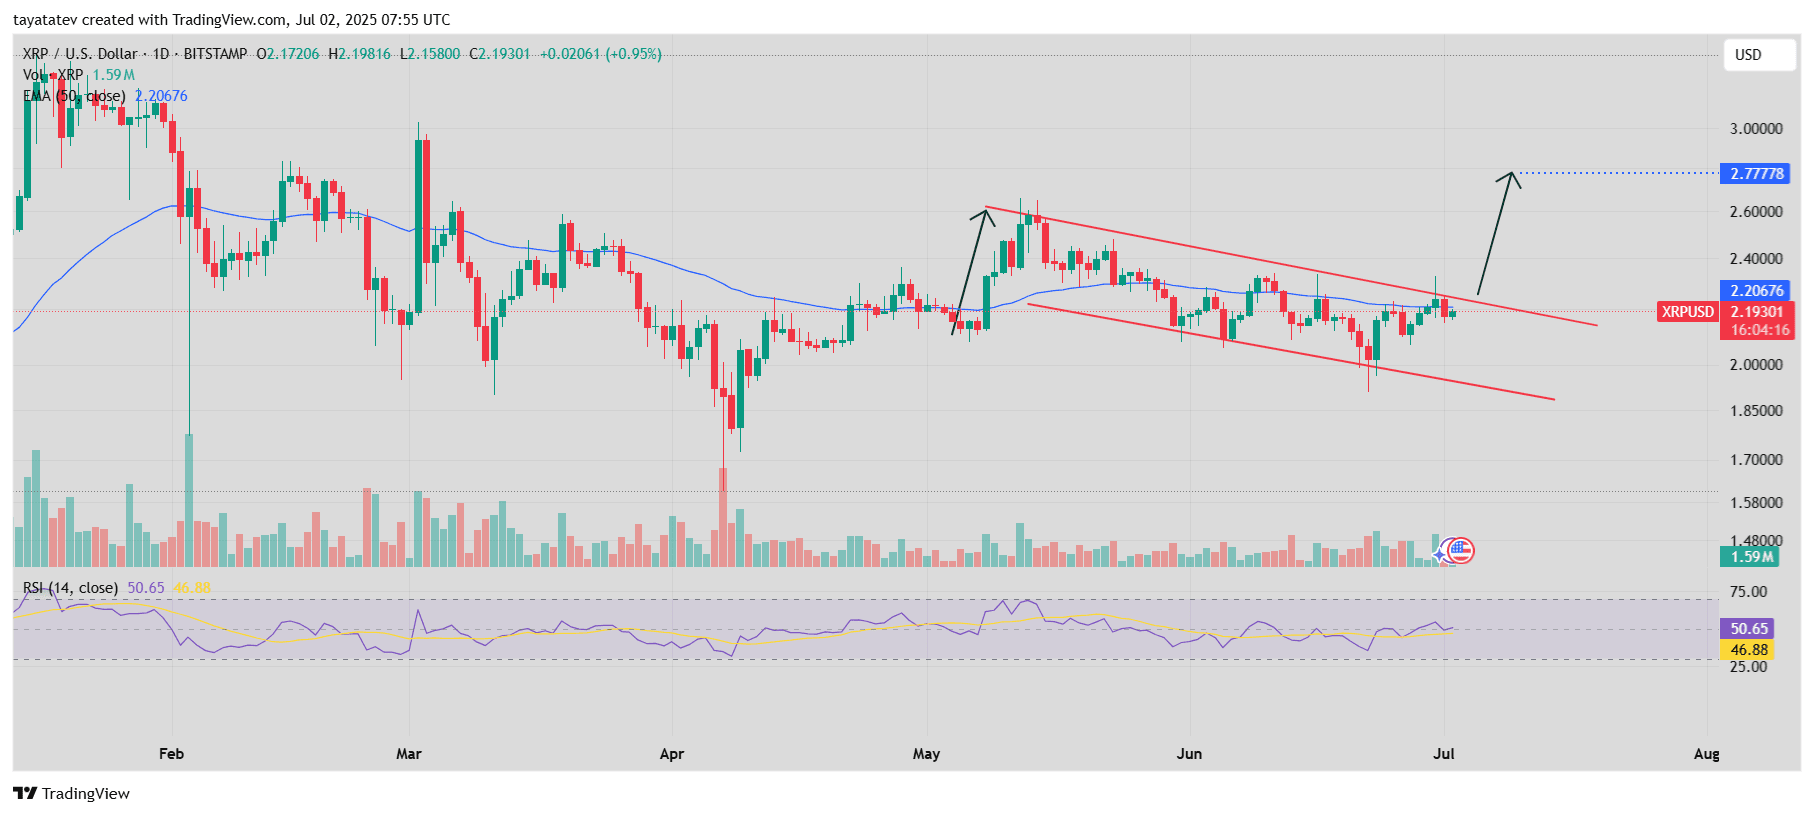
On July 2, 2025, XRP/ USDT created a bullish flag pattern on the daily chart. A bullish flag is a short-term consolidation pattern that appears after a strong price increase. It usually forms between two parallel downward-sloping trendlines and often signals that the price may rise again once the pattern is broken.

In this chart, XRP first rallied sharply in early May, then moved inside a descending channel. This setup forms the flag part of the pattern, while the sharp rise before it forms the flagpole. The structure is visible between mid-May and early July.
If XRP confirms a breakout above the upper red trendline of the flag, the price could rise by about 26% from the current level of $2.19. This projected move puts the next potential target around $2.77.
The price is now testing the top of the flag pattern, near the 50-day Exponential Moving Average (EMA) at $2.20. If bulls push it above this line with strong volume, the breakout could confirm. The Relative Strength Index (RSI) is hovering around 50.65, which shows neutral momentum but leaves room for upward movement.
Volume remains moderate. However, if it spikes during the breakout, it would add strength to the bullish case.
If confirmed, this bullish flag could mark a continuation of the earlier uptrend. The key is a clean break above the flag’s upper trendline with high volume.


دیدگاهتان را بنویسید