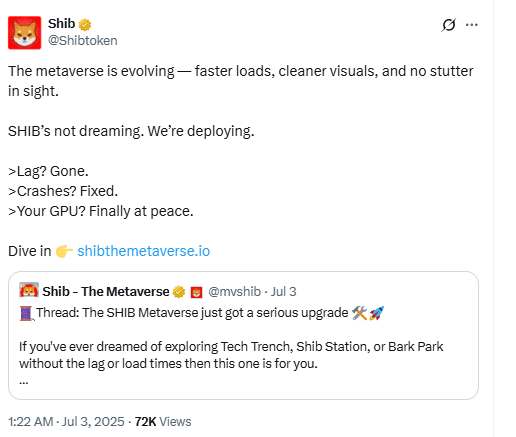
Shiba Inu has launched a major performance update for its metaverse platform, SHIB: The Metaverse. Announced on July 3, the upgrade targets critical issues like crashes, slow loading, and stutters across three central hubs—Bark Park, Tech Trench, and Shib Station.
According to Shiba Inu’s official X account, the update restructures technical elements rather than changing cosmetics. Developers said they aimed to eliminate game crashes, shorten loading times, and ensure smoother gameplay across devices.

GPU Optimization Enables Smoother Exploration
The patch includes major GPU optimizations. Developers resized over 200 texture assets, merged duplicate texture maps, and simplified material complexity. These changes reduced GPU memory usage by 15–25%. The team also added smarter mip-streaming, which allows high-resolution textures to load only when needed.
These improvements enable mid-range and lower-end machines to run SHIB: The Metaverse smoothly, without affecting graphic quality. The team stated,
“No crashes during walkthrough. No stutters at spawns. Just smooth, optimized metaverse exploration.”
Mobile Version and New Game in Development
The July 3 update is part of a broader rollout. Developers plan to release a mobile version of SHIB: The Metaverse and a new fishing game soon. The upcoming game will introduce the foundation for SHIB’s in-game economy, according to official updates.
SHIB: The Metaverse entered early access in December 2024. It is currently available on Windows and web browsers, including Chrome. Further updates will expand features and interactivity inside the virtual space.

Analysts Note Double-Bottom Pattern in SHIB Charts
While the upgrade targets functionality, analysts also spotted a double-bottom chart formation as SHIB trades near its year-to-date low of $0.00001130. The pattern often signals a potential trend reversal.
Data from WhatzTheTicker shows that SHIB’s supply on exchanges is falling while futures open interest is climbing. Analysts noted that if Bitcoin resumes upward momentum, SHIB could follow.
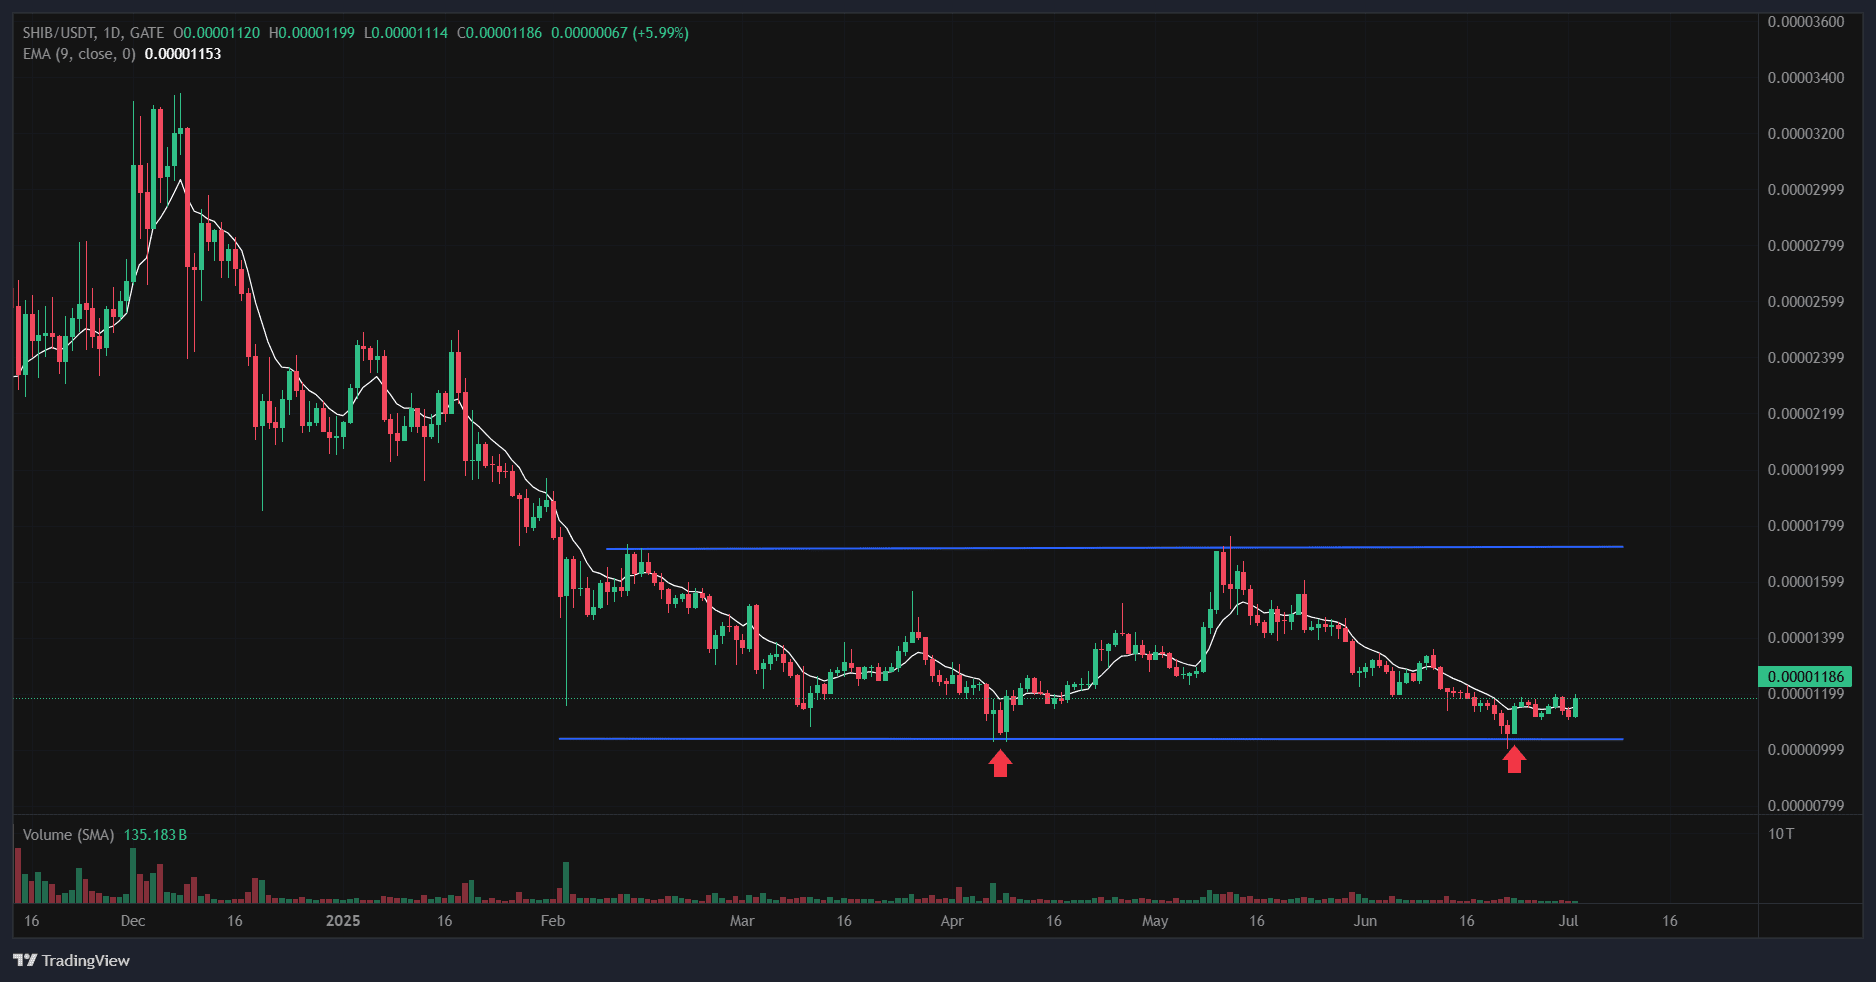
The chart shows two strong rebounds from the $0.00000985 level, one in early April and another in late June. Both lows formed with visible lower wicks and increased trading volume, which indicates that buyers consistently defend this support zone. Between these rebounds, SHIB briefly reached a local high near $0.00001780 before retracing again. This forms the classic W-shape of a double-bottom, often viewed as a bullish structure if confirmed with a breakout above the midpoint resistance.
The 9-day exponential moving average currently sits near $0.00001153. On July 4, SHIB traded above that level at around $0.00001186. That daily close placed it above both the EMA and the YTD low, suggesting early strength returning to the market. However, confirmation would require sustained closes above the neckline near $0.00001780, ideally with higher volume.
Meanwhile, on-chain data shows that fewer SHIB tokens are being held on centralized exchanges, suggesting that holders are not planning to sell in the short term. At the same time, rising futures open interest indicates a build-up of leveraged positions. This shift in positioning often precedes price moves, especially when accompanied by a potential technical reversal pattern.
SHIB’s recovery momentum remains linked to broader market conditions. If Bitcoin strengthens again, SHIB could gather enough volume to test the neckline. Until then, it continues to consolidate just above its multi-month support with increased on-chain and technical optimism.
The latest update reinforces Shiba Inu’s metaverse strategy. By improving performance and preparing for mobile expansion, the team continues to move toward full implementation of its virtual ecosystem.
SHIB Forms Bullish Flag, Eyes 40% Upside
The chart, created on July 4, 2025, shows Shiba Inu (SHIB) SHIB/ USDT forming a bullish flag pattern. A bullish flag is a continuation pattern that forms after a sharp price rally, followed by a downward-sloping consolidation range, resembling a flag on a pole. It often indicates that the price may break out and continue moving in the direction of the prior uptrend.
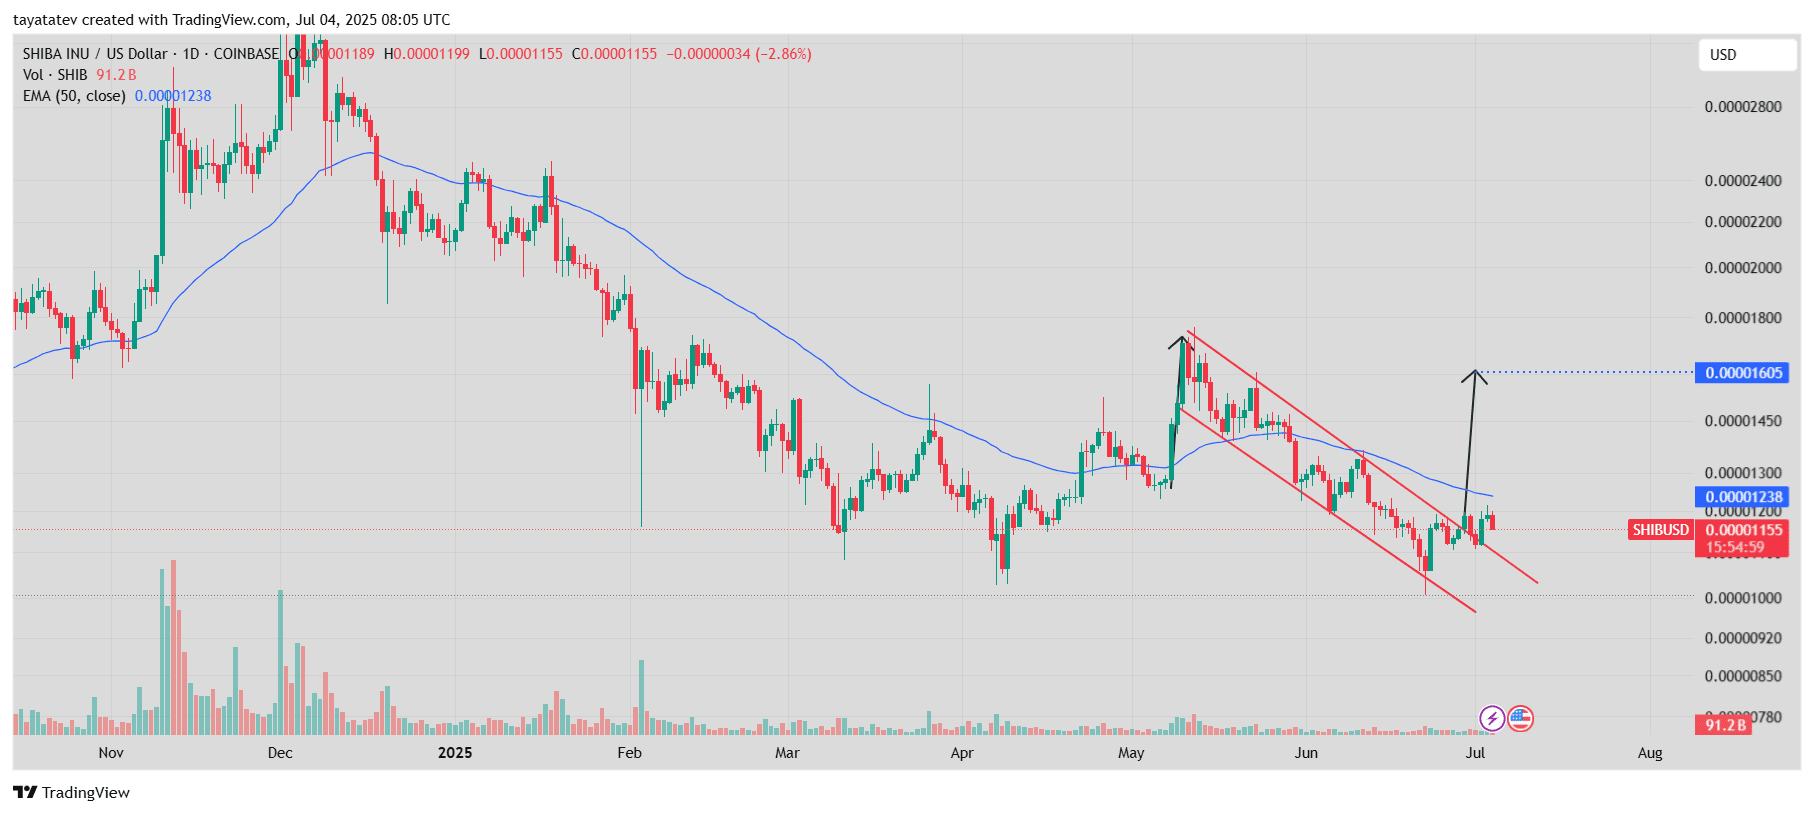
SHIB surged strongly in late April, forming the “flagpole,” then consolidated downward between parallel trendlines. This pullback formed the “flag.” On July 3, SHIB briefly broke out of the pattern, rising by 4%, but failed to hold the breakout and retraced below the upper boundary.
The 50-day Exponential Moving Average (EMA), currently at $0.00001238, now acts as short-term resistance. SHIB trades below that at $0.00001155. The projected breakout target for this bullish flag is $0.00001605, about 40% above the current price level.
The structure remains intact as long as SHIB stays inside or near the upper flag boundary. Volume data shows fading selling pressure since June, with increasing buying activity during attempted breakouts. A confirmed daily close above the flag and the 50-day EMA may trigger a move toward the measured target.
SHIB MACD Crossover Strengthens Bullish Setup
Meanwhile, the daily MACD (Moving Average Convergence Divergence) for Shiba Inu (SHIB). This indicator plots the relationship between two exponential moving averages—typically the 12-day (blue line) and the 26-day (orange line). It also includes a histogram that visualizes the difference between these two lines.
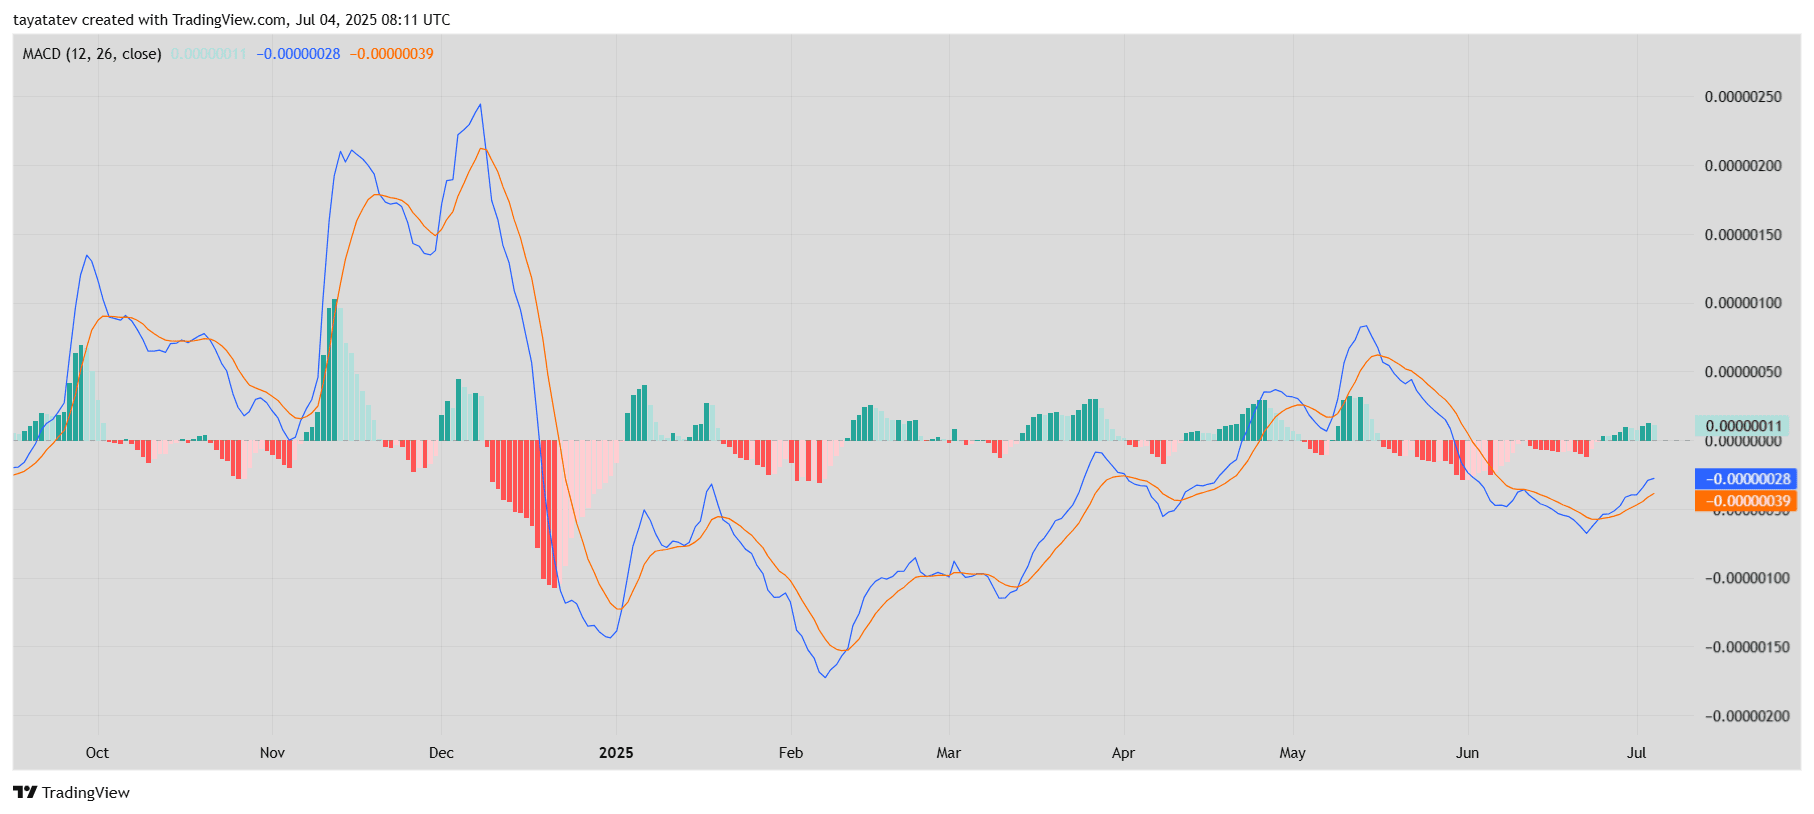
Currently, the MACD line has crossed above the signal line below the zero line. This is a bullish crossover, often considered an early signal of a potential uptrend. The histogram also flipped to green, confirming growing positive momentum after a long red phase through June.
This MACD movement supports the bullish flag breakout setup seen on SHIB’s price chart. While the crossover occurred below the neutral (zero) line, it still shows improving sentiment. If this momentum sustains and the MACD line moves above zero, it would indicate trend reversal confirmation.
Volume remains moderate, but the rising histogram bars show that bullish strength is gradually building. If SHIB maintains this upward momentum, the MACD could align with the 40% upside projection based on the bullish flag.
SHIB RSI Shows Neutral Momentum With Signs of Recovery
The 14-day Relative Strength Index (RSI) for Shiba Inu (SHIB), which currently reads 45.39. RSI measures the speed and change of price movements on a scale from 0 to 100. Values above 70 typically suggest overbought conditions, while values below 30 point to oversold zones.
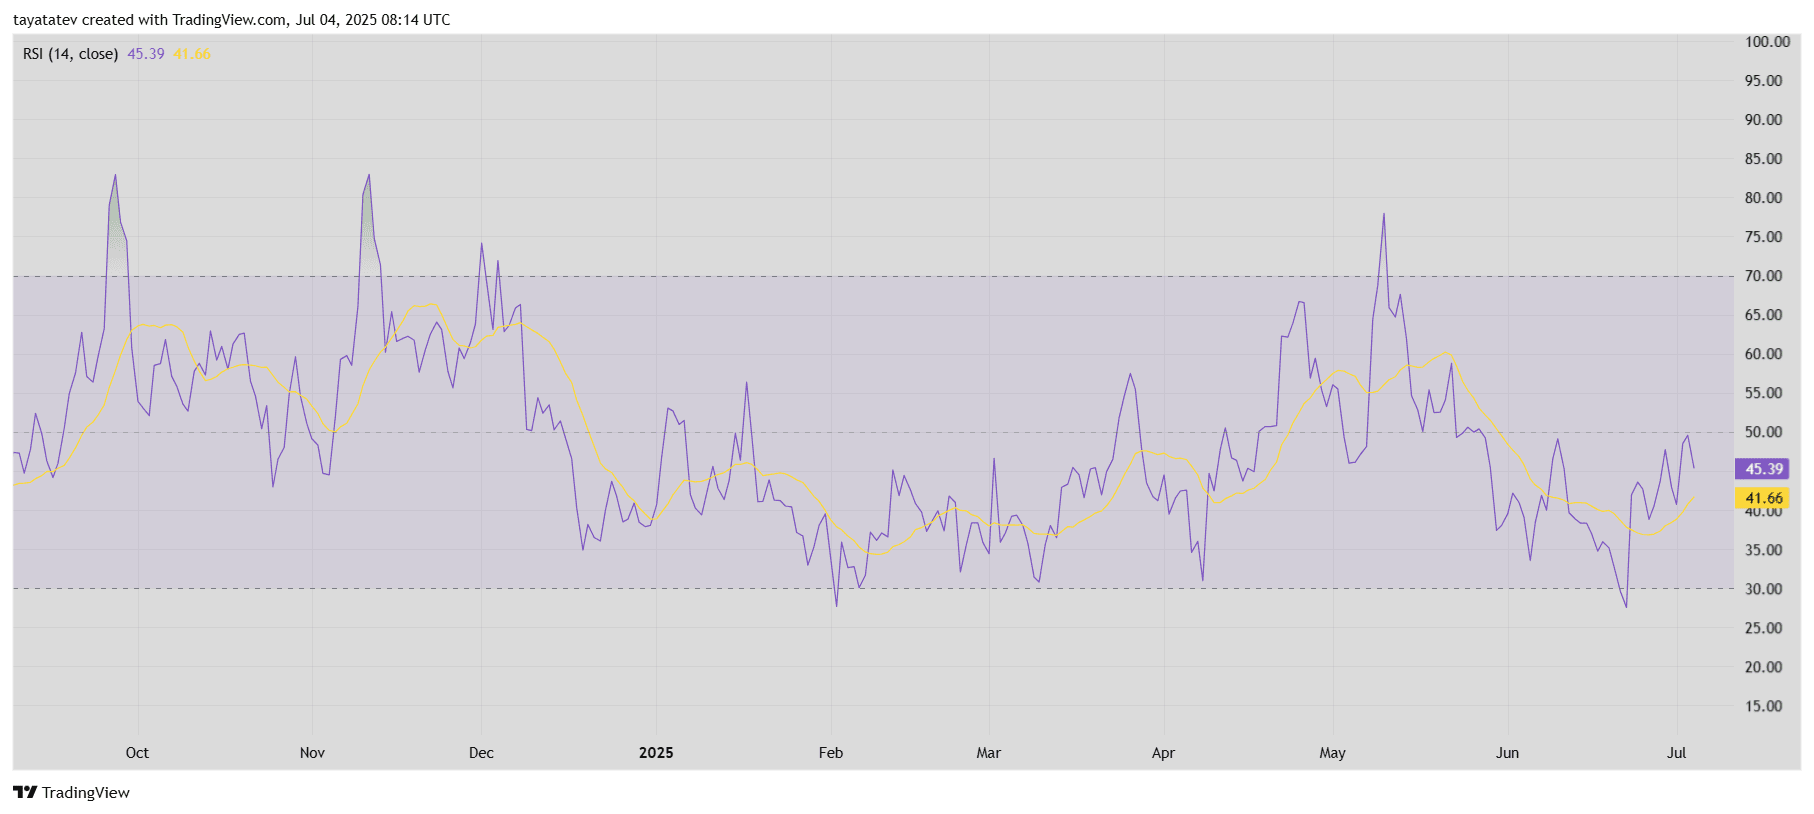
SHIB’s RSI climbed from under 30 in late June, confirming that the token rebounded from oversold territory. The yellow signal line (RSI moving average) stands at 41.66, slightly below the RSI itself, indicating that short-term momentum is improving. However, the RSI remains below the neutral 50 level, which means bullish strength is still limited.
The upward slope of the RSI reflects SHIB’s recent bounce and aligns with the bullish signals from the Moving Average Convergence Divergence (MACD) and bullish flag setup. If RSI continues to climb and crosses 50, it could support a broader trend shift to the upside. Until then, the current reading shows SHIB has exited extreme weakness but hasn’t yet entered confirmed bullish territory.
دیدگاهتان را بنویسید