
Mercado Bitcoin, one of the largest crypto platforms in Latin America, will tokenize over $200 million in real-world assets (RWAs) on the XRP Ledger (XRPL). The project focuses on fixed-income and equity-based instruments.
This is one of the region’s biggest tokenization moves using a public blockchain. The announcement reflects the platform’s strategy to support regulated asset access across Latin America and Europe. The assets will be issued on XRPL’s permissioned infrastructure.

Silvio Pegado, Ripple’s Managing Director for Latin America, said the partnership shows growing institutional use of public blockchain systems.
“Mercado Bitcoin’s integration with the XRPL shows how public blockchain infrastructure is being trusted by institutions and is becoming a reliable foundation for bringing regulated financial products to the market,”
Pegado stated.
XRP Ledger Gains Presence in Real-World Asset Market
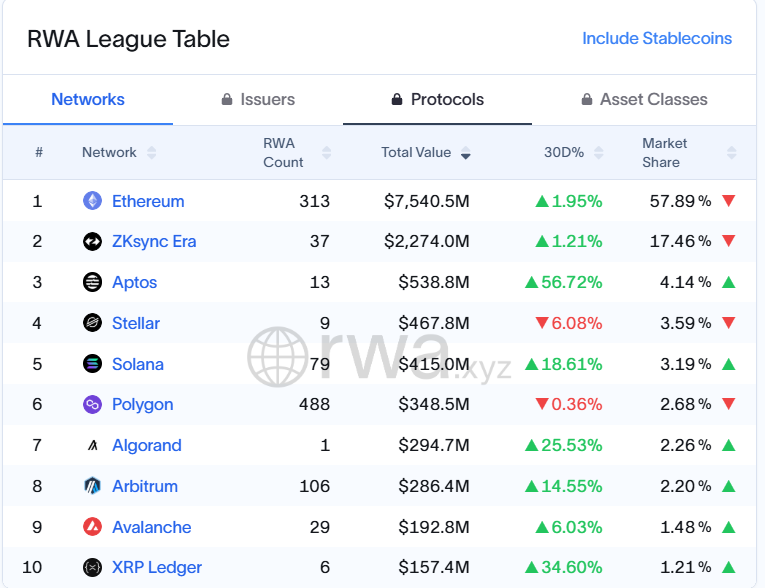
The XRP Ledger holds about $157 million in tokenized assets, placing it in 10th position among blockchain networks, according to RWA.XYZ. In contrast, Ethereum leads with around $7.5 billion in tokenized asset value.

Tokenization refers to the process of issuing blockchain-based digital versions of traditional assets like bonds or stocks. The Ripple–Boston Consulting Group report projects this market to exceed $600 billion in 2025 and reach $19 trillion by 2033.
Pegado highlighted XRPL’s low fees and fast transaction speed as key benefits. He also emphasized the importance of compliance for institutions working with tokenized assets.
“With the kind of infrastructure the XRPL offers, it’s now possible to bring these [RWA] assets onchain in a way that meets institutional expectations for cost, speed, and compliance,” Pegado said.
XRPL Adds EVM-Compatible Sidechain and Other Upgrades
The XRP Ledger recently introduced several upgrades to improve performance and broaden usage. One of the key updates includes an EVM-compatible sidechain, allowing Ethereum-native applications to operate on XRPL infrastructure.
Other upgrades include batch transactions, cross-chain interoperability, token escrow, and permissioned decentralized exchanges. These features support asset management and increase appeal for institutional platforms like Mercado Bitcoin.
These technical changes aim to support secure and efficient tokenized asset activity. Pegado said these capabilities position XRPL as a suitable platform for financial institutions operating in Latin America and Europe.
XRP Forms Falling Wedge Pattern on Weekly Chart With Target Near $10.45
The XRP to US Dollar (XRP/USD) weekly chart, published on July 6, 2025, shows a clear falling wedge pattern forming after a strong price rally earlier this year. This chart uses data from the Bitstamp exchange and was created with TradingView. At the time of the chart, XRP traded at $2.26, showing a weekly gain of +2.47%.
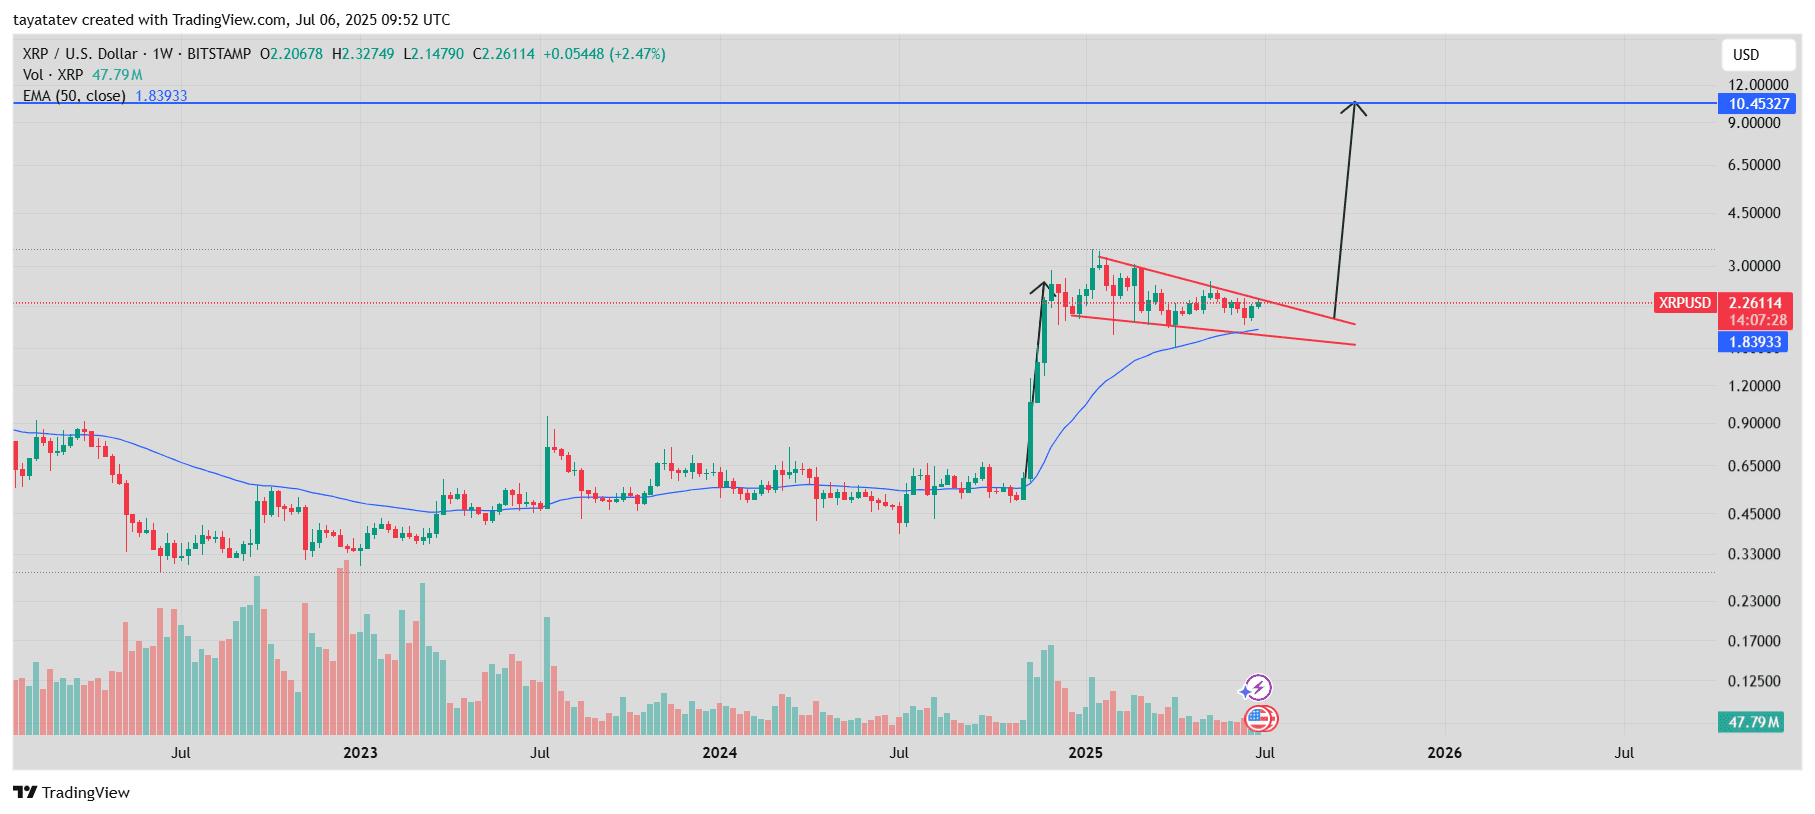
A falling wedge is a price pattern where the asset moves down between two sloping trendlines that gradually get closer. Although the price declines, this pattern often suggests a future move to the upside once the resistance trendline breaks.
XRP’s current wedge formed after a sharp jump, followed by weeks of lower highs and lower lows. These candles fit between the wedge’s narrowing structure. Price action remains above the 50-week exponential moving average (EMA), which is now at $1.83. This EMA level acts as support and reflects strength in the longer trend.
If XRP breaks above the wedge resistance, the pattern may confirm, and the price could move toward $10.45. That would be a rise of nearly 367% from the current level. The chart marks this level with a horizontal blue line. Falling wedges that break out often reach this kind of vertical target, measured from the widest part of the pattern.
Volume sits at 47.79 million, showing steady trading interest during the pattern’s formation. The candles have started forming higher lows, signaling weakening seller pressure. These signs support the idea that momentum is building for a breakout.
XRP needs to hold above the 50-week EMA and break the wedge’s upper boundary to validate this setup. If this happens, technical conditions point to a significant upside toward the target zone.
XRP Weekly RSI at 52.83 Shows Neutral Momentum With Possible Shift Ahead
The XRP/USD Relative Strength Index (RSI) chart shows the 14-period RSI at 52.83. This level sits slightly above the neutral midpoint of 50, suggesting that XRP is neither overbought nor oversold at the moment. The chart also includes a yellow line representing the RSI’s moving average, currently at 52.41, which helps smooth out short-term fluctuations.
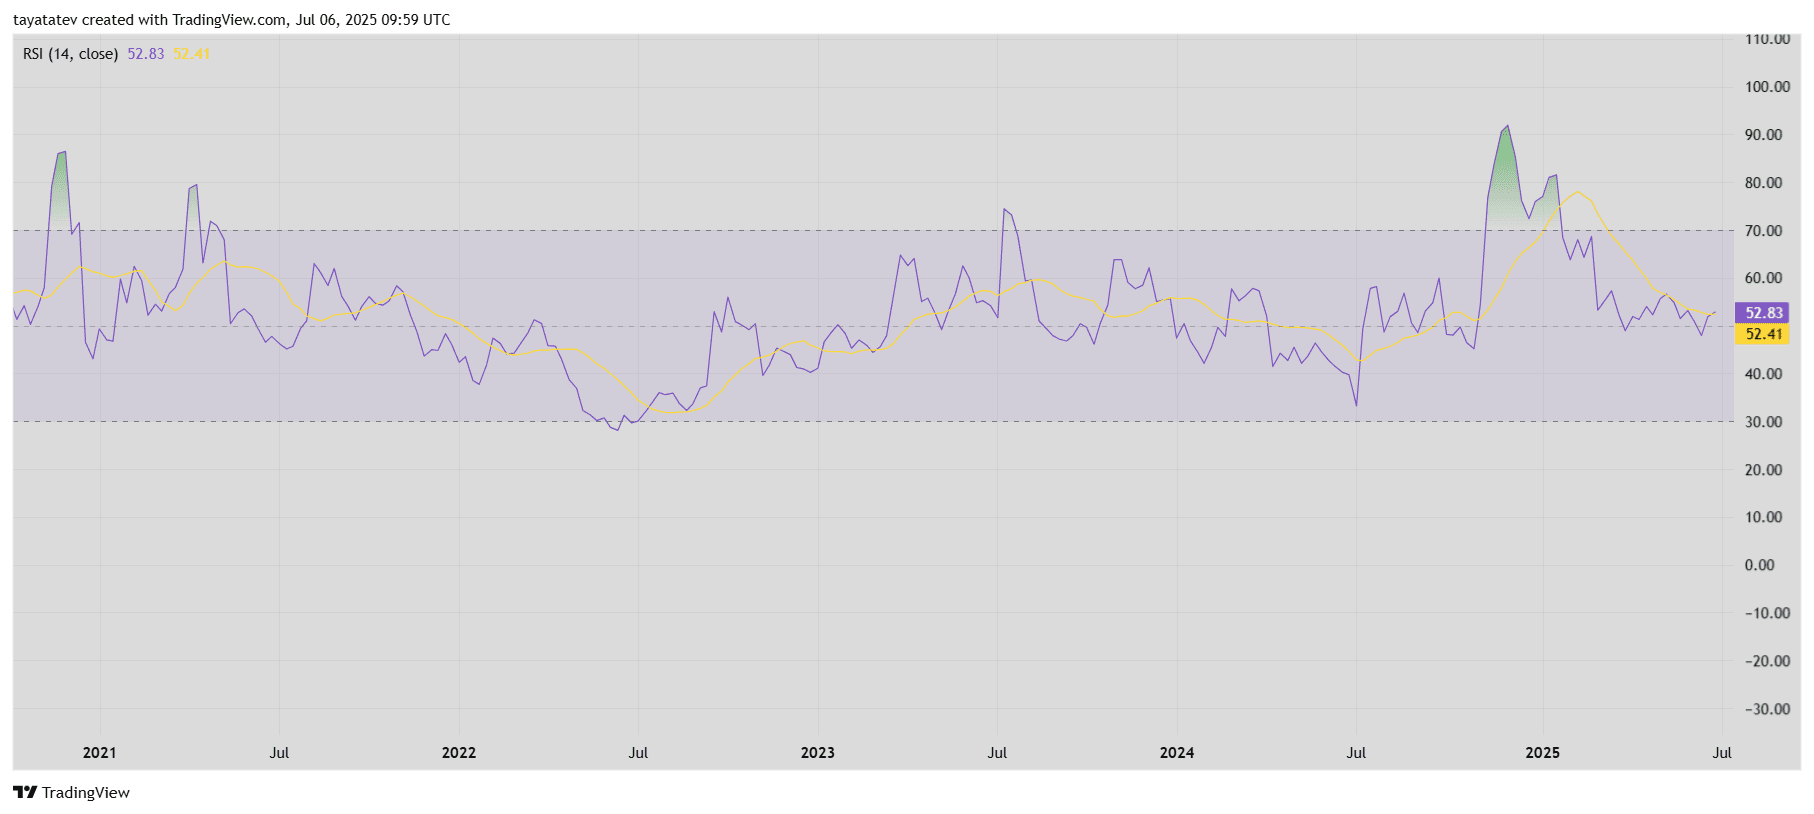
The Relative Strength Index (RSI) is a technical indicator used to measure the speed and change of price movements. It ranges from 0 to 100. Values above 70 are considered overbought, while values below 30 are seen as oversold. A reading near 50 usually signals neutral momentum, meaning there’s no strong trend either upward or downward.
Since early 2025, XRP’s RSI has dropped from overbought conditions seen above the 70 level. That previous spike was followed by a steady decline, reflecting slower buying activity. The RSI then stabilized near the 40 level in April and has since moved back toward the mid-range.
Now that the RSI has climbed back above its moving average, the indicator suggests a balance between buyers and sellers. The RSI line and its moving average are both sloping slightly upward, indicating a possible momentum shift. However, the strength remains moderate, and no overbought or oversold condition is currently present.
Overall, the RSI shows neutral pressure for XRP as of early July 2025. It confirms that the price is not under excessive buying or selling pressure and remains in a consolidation phase.
XRP Weekly MACD Shows Bearish Momentum Easing as Histogram Narrows
The XRP to US Dollar (XRP/USD) MACD (Moving Average Convergence Divergence) chart, published on July 6, 2025, shows a declining bearish momentum after a strong move earlier this year. The chart uses the 12-26-9 MACD settings and was created on TradingView.
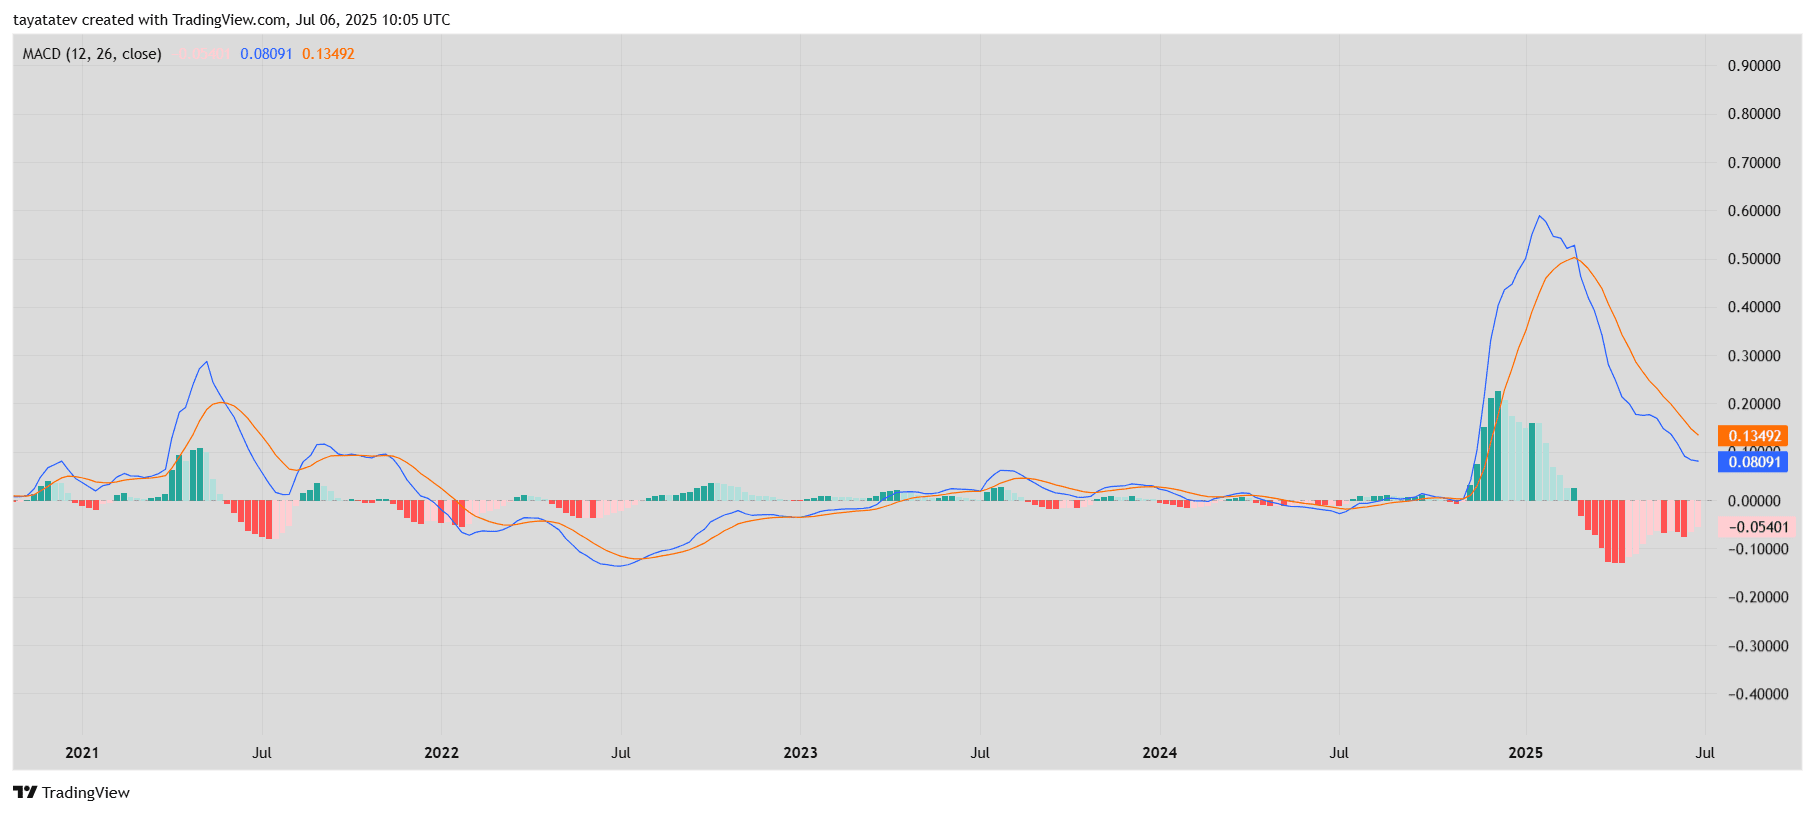
MACD consists of two lines—the MACD line (blue) and the signal line (orange)—along with a histogram that represents the difference between them. When the MACD line crosses above the signal line, it often indicates a possible upward trend. A cross below suggests the opposite.
Currently, the MACD line is at 0.08091, while the signal line is at 0.13492. Since the MACD line remains below the signal line, XRP still shows bearish pressure. However, the histogram is now moving closer to the zero line, with the latest value at -0.05401. This narrowing signals that the downward momentum is weakening.
Earlier in 2025, the MACD lines reached highs above 0.6 during XRP’s strong rally. After peaking, the lines reversed, and red bars appeared on the histogram, showing selling momentum. This negative phase lasted for several weeks, with red bars increasing in height. More recently, the red bars have started to shrink, suggesting that the selling activity may be slowing down.
The MACD structure still leans bearish, but the pace of decline has decreased. If the MACD line moves back above the signal line, the chart may show early signs of a momentum shift.
دیدگاهتان را بنویسید