
Grayscale has added BONK, Hyperliquid, and 29 other tokens to its latest “Assets Under Consideration” list for Q3 2025. The list, published by Grayscale Research on July 10, reflects a strategic shift in the company’s altcoin focus. This time, only 31 tokens made the cut—down from 40 in the previous quarter.

BONK Makes the List Amid Market Gains
BONK stands out as one of the newly added tokens, having posted notable price gains over recent months. However, Grayscale has not explained why BONK or any of the others were selected. Despite the lack of reasoning, BONK’s inclusion marks a significant move as Grayscale continues to explore meme coin exposure in its product strategy.
Grayscale, known for its flagship Bitcoin Trust and various crypto investment vehicles, updates its Assets Under Consideration list quarterly. The Q3 update reveals a leaner selection, suggesting a more selective approach. BONK appears in this narrowed group, which now includes fewer smart contract and utility tokens.
Altcoin Count Shrinks, AI Category Added
Compared to Q2 2025, several altcoins were removed, including TRON, VeChain, and Immutable. Grayscale reduced its smart contract-related assets from 12 to 7, and its “Utilities & Services” category shrank from 13 to 4 tokens.
The firm also introduced a new category focused on artificial intelligence (AI) tokens. Some assets from previous lists were reclassified under this new group, though details remain limited.
The following tokens were dropped from the Q2 list: Babylon, Berachain, Celestia, MOVE, TRON, VeChain, Mantra, ELIZA, Immutable, Akash, FET, Arweave, Eigen Layer, Geodnet, Helium, and Sentient.
Only a few tokens from past watchlists have made it into actual Grayscale products. The firm did not clarify how many from this quarter’s list might eventually be added to its investment offerings.
Rising Wedge Signals Possible 34 Percent Upswing
The one-hour BONK/ USDT chart created on 11 July 2025 at 07:55 UTC shows price compressing within a rising wedge, defined by an ascending support line and a slightly steeper resistance trendline. A rising wedge is a continuation setup that often resolves upward when buyers absorb supply along the upper boundary.
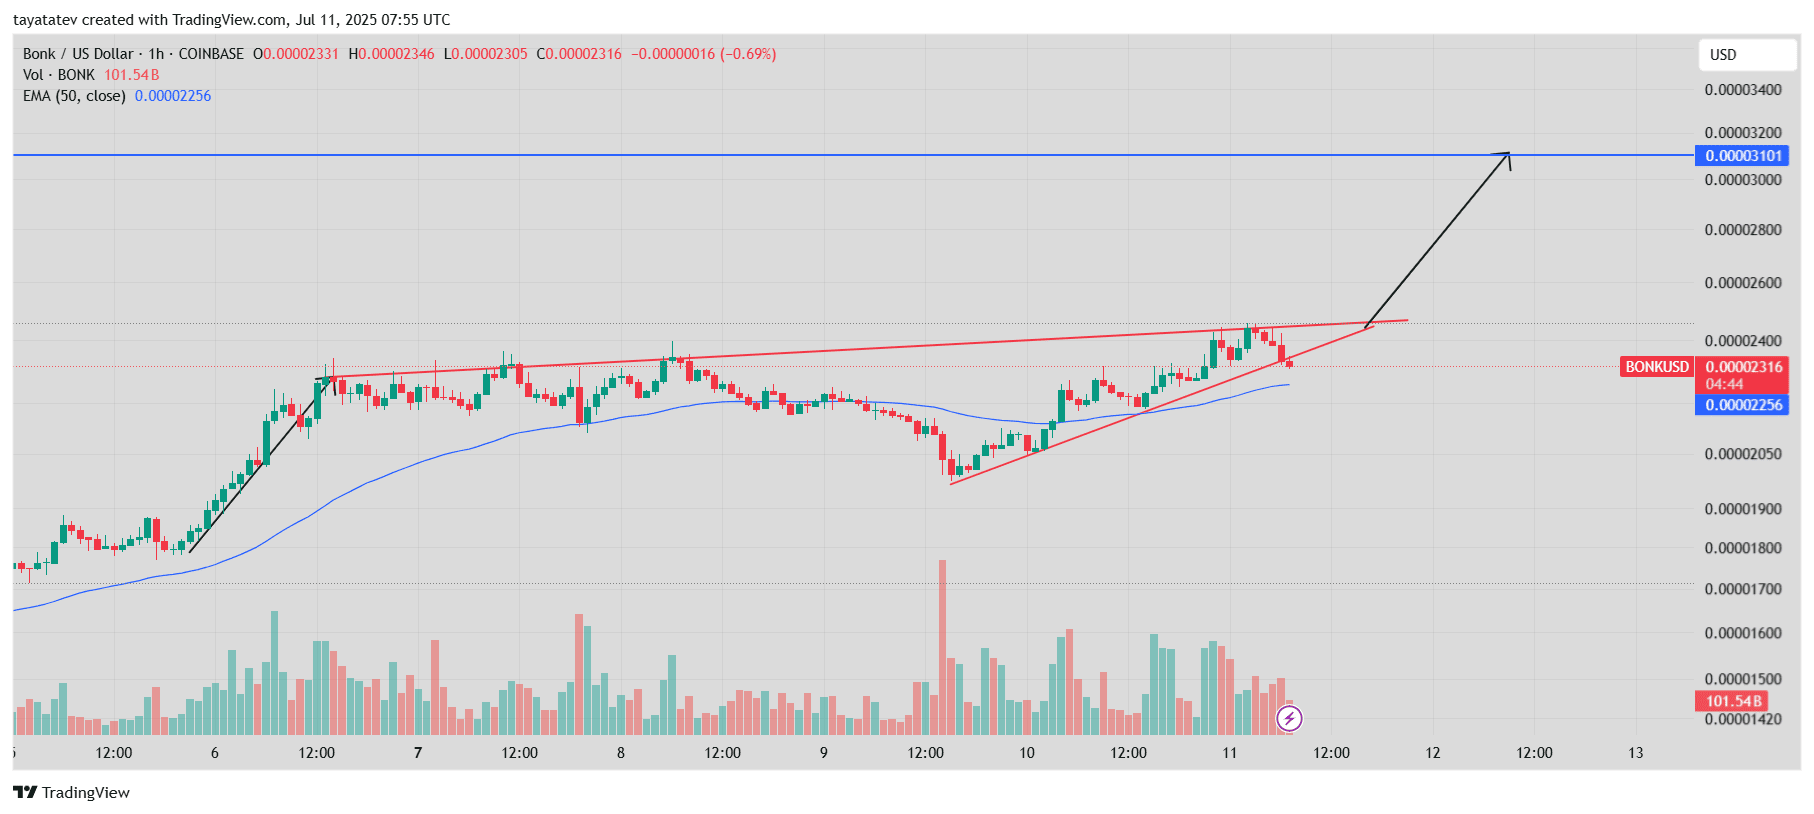
Price now trades near $0.00002316, just above the 50-period Exponential Moving Average (EMA), which sits at $0.00002256 and continues to angle higher. The wedge’s apex lies around $0.00002400; therefore, a decisive hourly close above that level would confirm the pattern. If confirmation arrives, the measured move projects roughly 34 percent above the breakout point, placing a provisional objective near $0.0000310.
Volume already shows a mild uptick during recent tests of resistance, suggesting growing momentum. Meanwhile, the EMA offers immediate dynamic support, keeping bulls in control as long as candles close above it.
BONK RSI Signals Weakening Momentum but Still Holds Neutral Bias
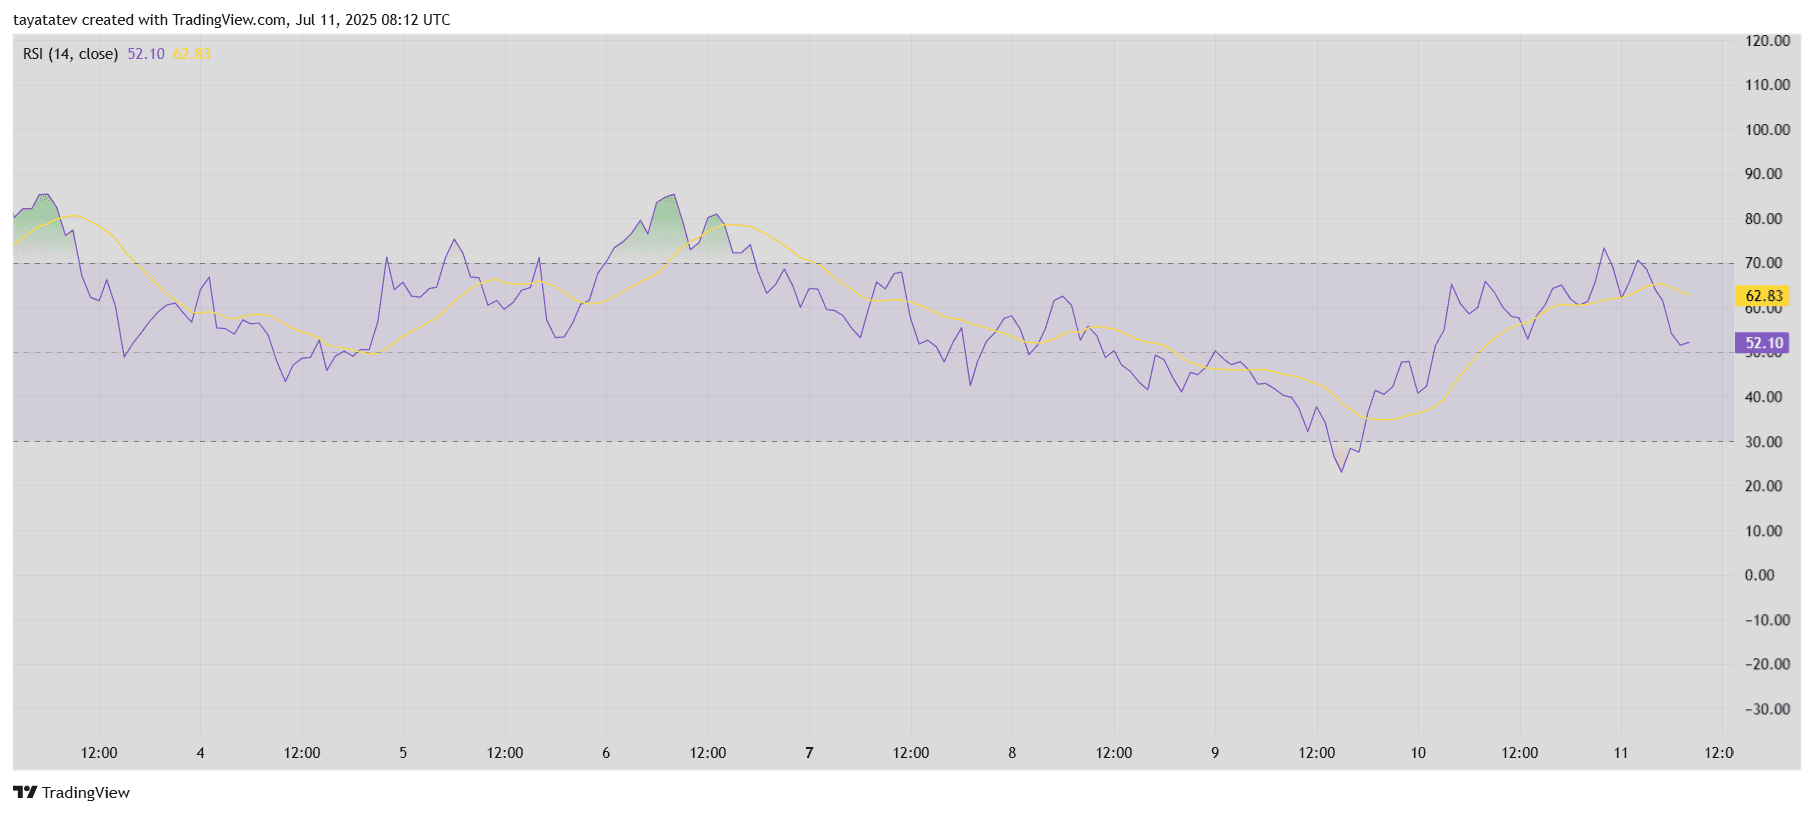
The Relative Strength Index (RSI) chart for BONK, created on July 11, 2025, at 08:12 UTC, shows a key momentum shift. The 14-period RSI now reads 52.10, just above the midpoint of 50, while its moving average trendline sits higher at 62.83. The divergence between the RSI value and its moving average highlights a short-term loss of bullish strength.
Source: TradingView
RSI, or Relative Strength Index, measures the speed and change of price movements. A reading above 70 signals overbought conditions, while below 30 signals oversold. When the RSI crosses below its moving average, it often suggests fading momentum, and that’s what is visible now. Although BONK still trades in neutral territory, the drop in RSI from the upper zone reflects slowing buyer interest.

For now, the RSI remains far from oversold levels and supports the idea that BONK is consolidating rather than reversing. However, if RSI dips below 50 and stays there, it could challenge the current bullish wedge breakout setup. In short, RSI shows cooling momentum but not yet a breakdown. Price must hold above support to maintain bullish continuation potential.
BONK Balance of Power Indicator Shows Strong Buyer Dominance
The Balance of Power (BoP) indicator for BONK, captured on July 11, 2025, at 08:21 UTC, reads 0.71, suggesting strong buyer control in the short term. This reading falls well into the positive zone, indicating that bulls are currently setting the pace and absorbing supply pressure.
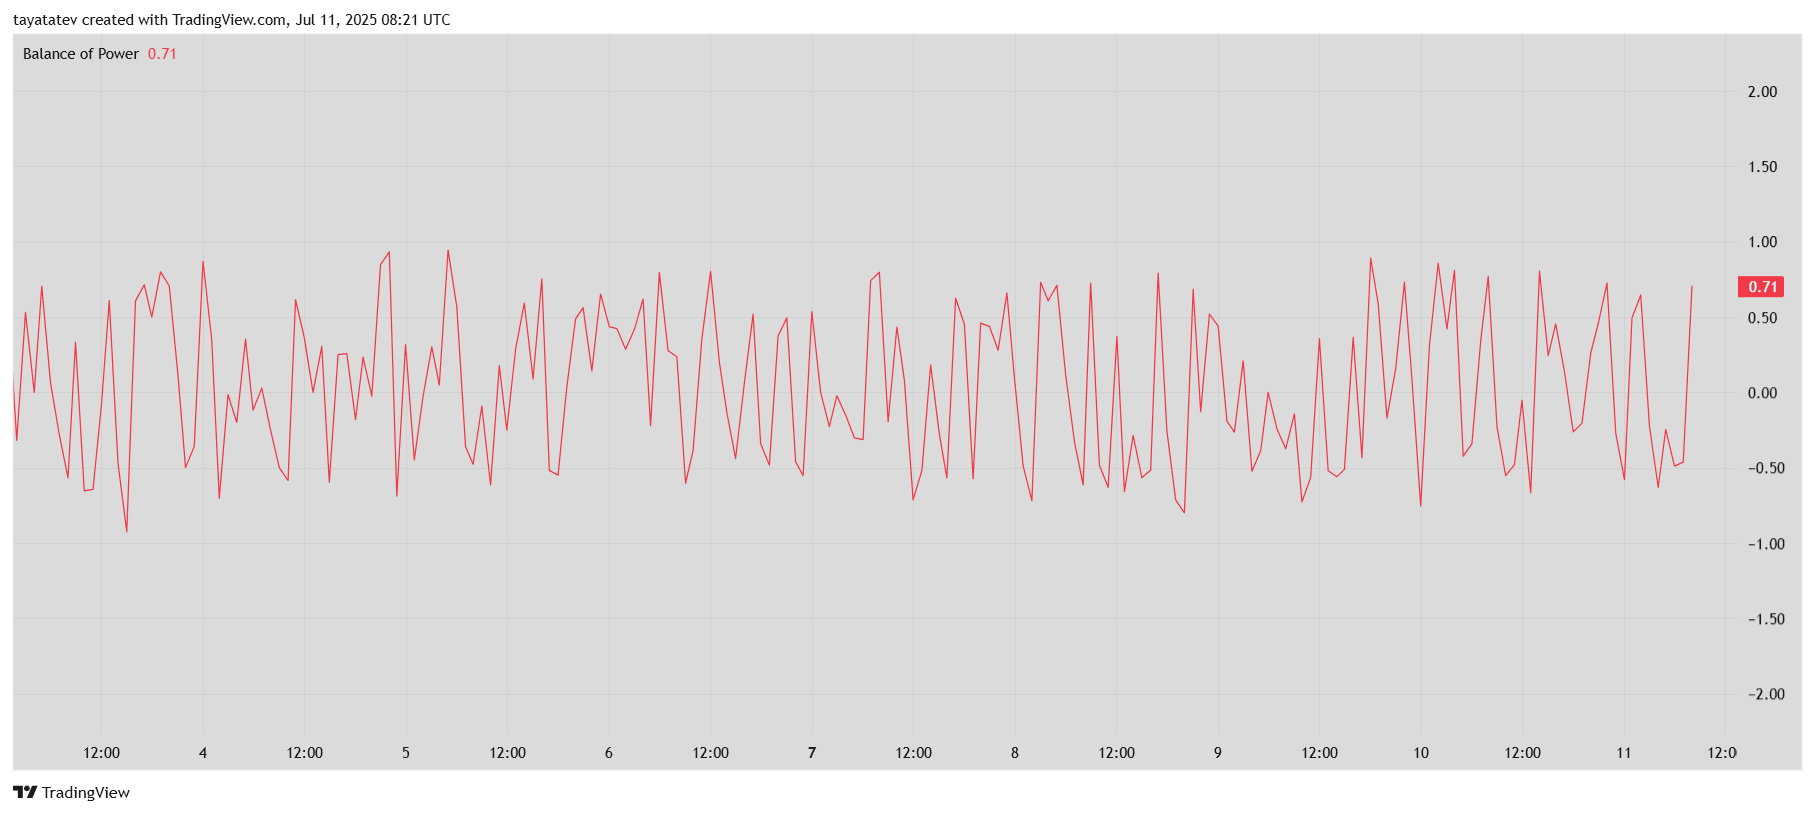
The BoP indicator measures the strength between buyers and sellers during a trading session. Values above zero imply buyers dominate, while readings below zero reflect selling pressure. The current 0.71 level implies buyers are consistently closing prices near the top of each bar’s range, which supports the upward continuation shown in BONK’s rising wedge pattern.
Despite the high volatility across recent sessions, this positive BoP reading reinforces bullish conviction. If sustained, it may support the wedge breakout setup discussed earlier and help drive price closer to the $0.0000310 target.
BONK MACD Shows Weak Bullish Momentum as Histogram Turns Negative
The Moving Average Convergence Divergence (MACD) chart for BONK, created on July 11, 2025, at 08:23 UTC, signals a weakening uptrend. The MACD line, currently at 0.00000040, has moved slightly below the signal line at 0.00000049, while the histogram prints a negative bar of -0.00000009.
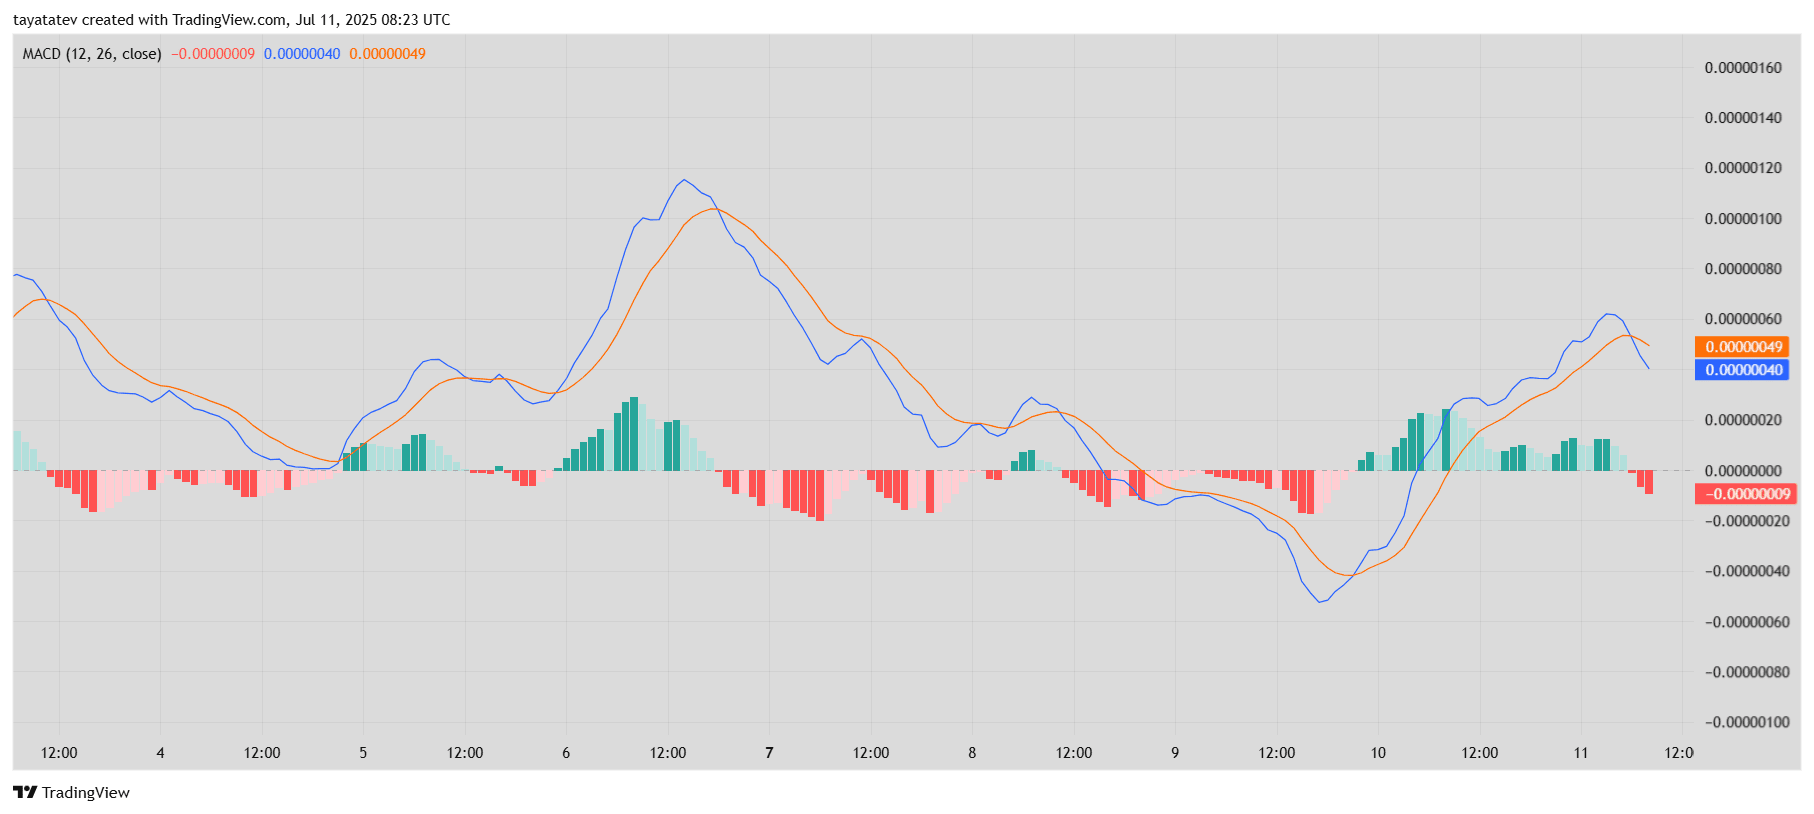
MACD, which uses the 12-period and 26-period exponential moving averages, identifies momentum shifts. A bullish crossover occurs when the MACD line rises above the signal line, while a bearish crossover happens when it dips below. In this chart, the MACD line has just crossed under the signal line after a recent upswing—indicating that the recent bullish push is slowing down.
While the crossover is minor, it confirms the cooling momentum also seen in the RSI. The histogram flip from green to red supports this view. For bulls to regain strength, the MACD line must reverse above the signal line with stronger histogram bars. Until then, BONK’s short-term trend stays cautious.
دیدگاهتان را بنویسید