
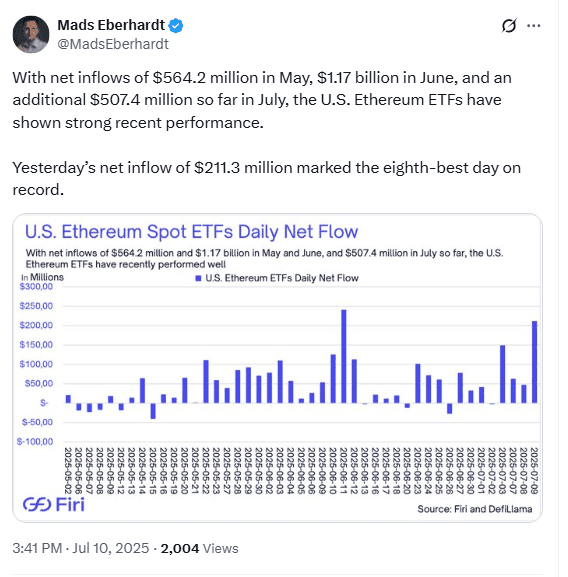
Ethereum ETFs attracted $890 million in net ETH inflows during the first 11 days of July 2025. This marks the highest monthly total since SEC approval in July 2024. Thursday alone delivered the eighth-largest daily tally on record, according to SoSoValue data.
These ETH inflows follow a sharp rebound in the Ethereum price. ETH broke above $3,000 for the first time since February 2025, adding nearly 20 percent in one week. Analysts link the price move to sustained demand from regulated funds and large corporate buyers.

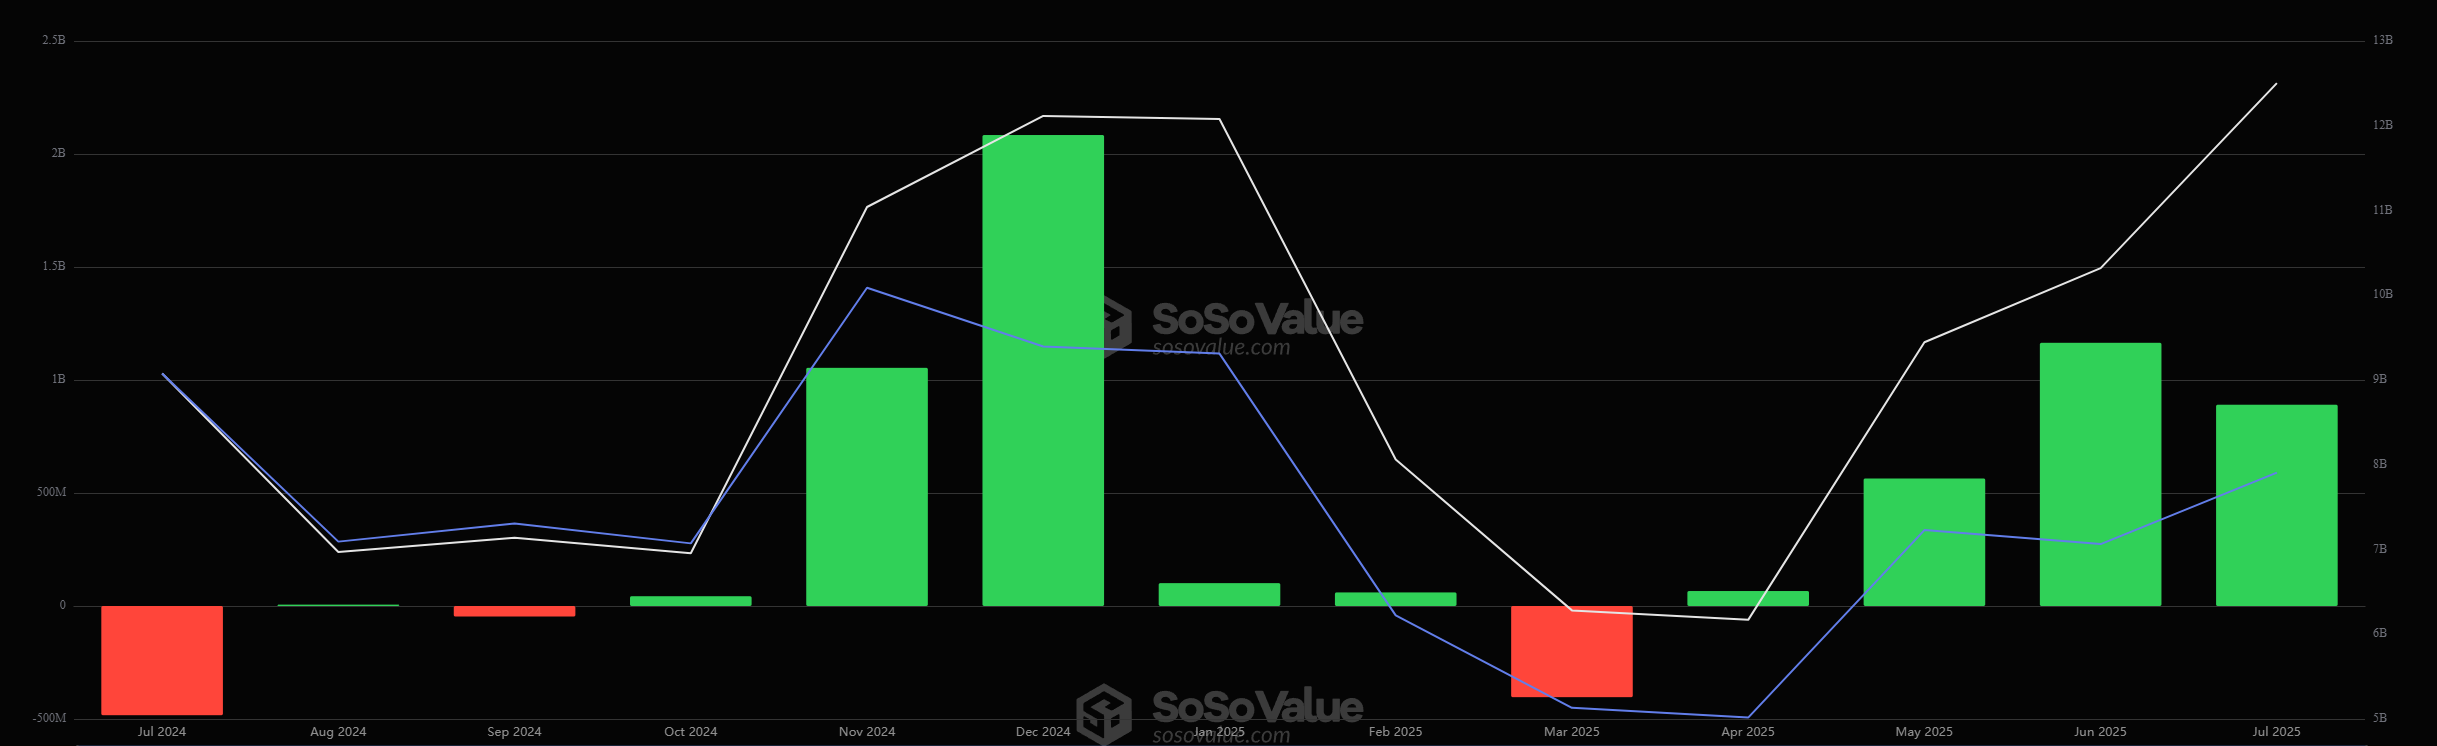
The spot Ethereum ETF surge has lifted cumulative inflows above those of many established crypto products. If the current pace continues, July will eclipse every previous month for Ethereum ETFs since their launch.
BlackRock ETH Holdings Tighten Supply
BlackRock ETH holdings now equal 1.5 percent of Ethereum’s circulating supply. The asset manager controls roughly $4.5 billion in ETH at present prices. Its accumulation started after SEC approval cleared ETFs to list in U.S. markets last year.
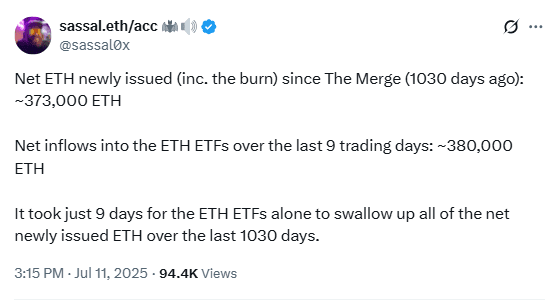
Other spot Ethereum ETF issuers also boosted positions. Combined, funds purchased about 380,000 ETH in the past nine days. This figure exceeds every newly issued token generated on the network over the same period.

Corporate treasuries have joined these funds in acquiring ETH. Their parallel buying further limits liquid supply available on exchanges, reinforcing the demand shock created by ETF inflows.
Spot Ethereum ETF Demand Tops New Issuance
Since the Ethereum Merge in September 2022, the network issues far fewer tokens than before. Lower issuance, paired with validator-burned fees, has reduced new supply to a trickle.
In July 2025, net ETH inflows into spot Ethereum ETF products surpassed total tokens minted since the month began. This imbalance suggests regulated vehicles are removing more ETH from the market than miners, now validators, can create.
The limited issuance rate means ETFs must compete for existing coins. Rising demand from funds therefore places upward pressure on Ethereum price while also underscoring supply-side constraints.
Market Data Shows Ethereum Price Resilience
Ethereum price resilience stands out against broader market movements. Although Bitcoin ETFs still hold larger dollar totals, ETH inflows have outpaced BTC products for nine consecutive trading days.
SoSoValue figures indicate that July’s ETH inflows now rival January’s historic Bitcoin ETF launch period on several measures. The data also show no significant outflows from Ethereum ETFs during this run, implying steady investor confidence.
With SEC approval behind them, spot Ethereum ETF providers continue to expand assets under management. Their combined activity signals persistent institutional interest and reflects a structural shift in how U.S. markets access Ethereum exposure.
Ethereum Forms Bullish Pennant on July 12, Signals Possible 9% Breakout
On July 12, 2025, Ethereum ETH/ USDT created a bullish pennant pattern on the 1-hour chart. A bullish pennant is a short-term continuation pattern that forms after a strong upward price movement, followed by a brief period of consolidation between converging trendlines.
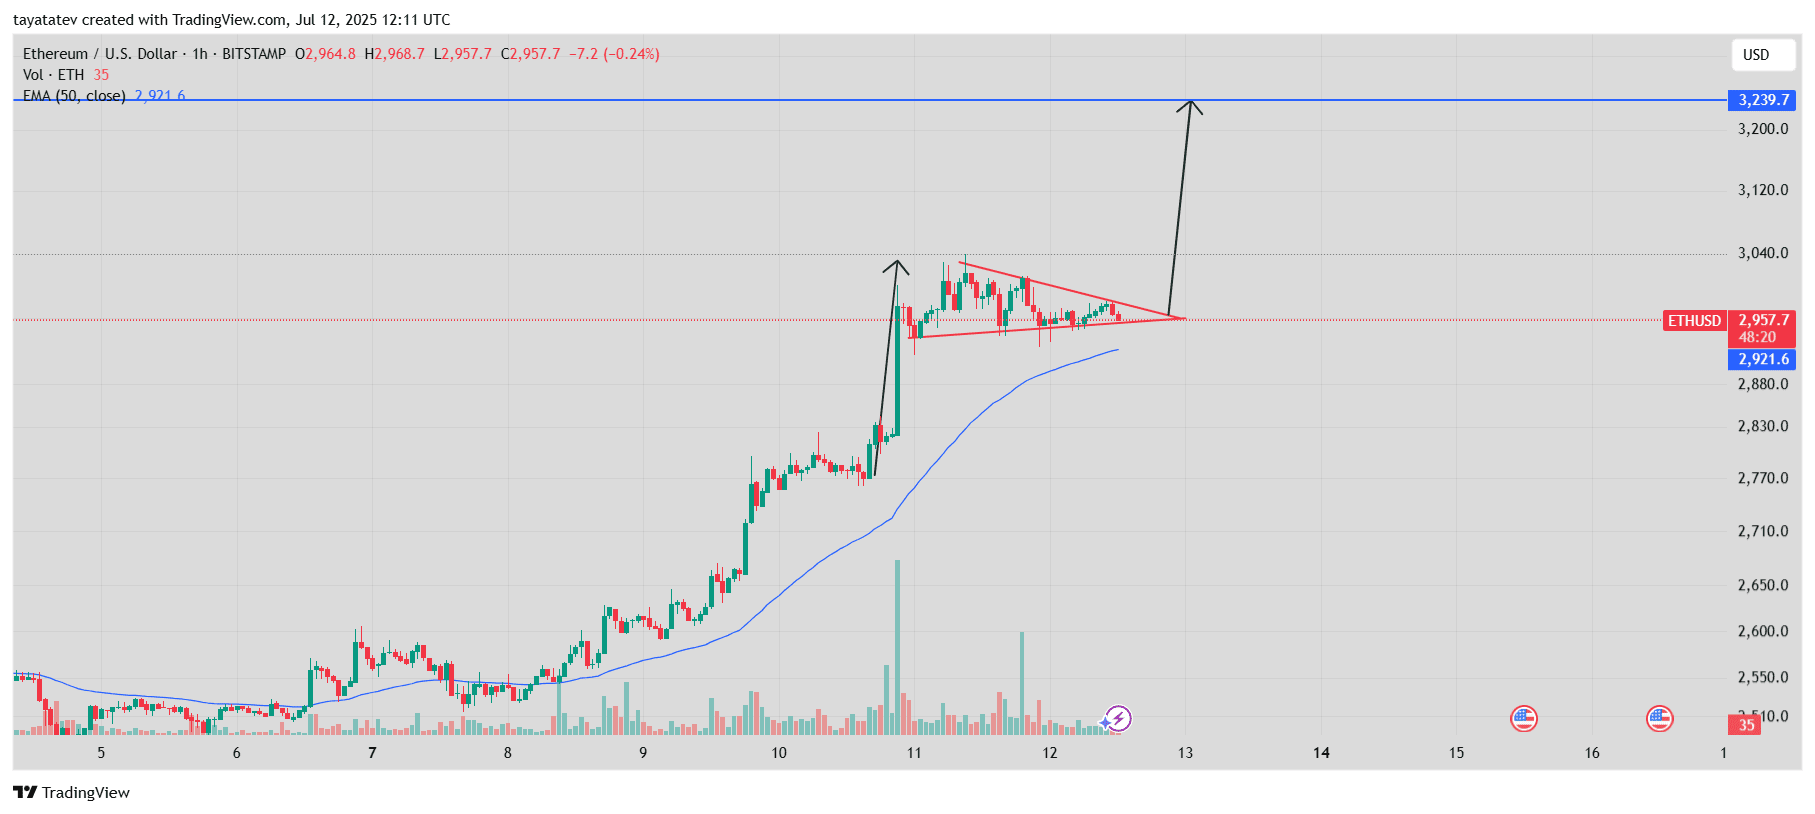
In this chart, Ethereum rose sharply above the 50-period Exponential Moving Average (EMA), marked in blue. The price moved from around $2,660 on July 10 to a high near $3,040 on July 11, then entered a narrow triangle-shaped consolidation. This triangle is the pennant portion of the formation.
The ETH price is now at $2,957 while the 50-period EMA stands at $2,921. If Ethereum confirms the breakout above the pennant’s upper resistance, it could increase by approximately 9 percent. A 9 percent move from the current price of $2,957 would bring the ETH price to around $3,225.
Volume activity also supports the pattern. The upward move on July 10 came with rising volume, and the consolidation has shown declining volume, which is typical for this setup. A breakout with strong volume would further validate the pennant.
The projected target at $3,239, shown in the chart, aligns closely with the expected 9 percent move from the breakout point. The price action remains above the key moving average, which supports the trend continuation structure.
Ethereum RSI Drops Below 50, Signals Short-Term Uncertainty
This Ethereum (ETH) 14-day Relative Strength Index (RSI) chart shows market momentum from July 1 to July 12, 2025. RSI is a technical indicator that measures the strength of recent price movements to identify overbought or oversold conditions. Readings above 70 indicate overbought conditions, while readings below 30 suggest oversold levels.
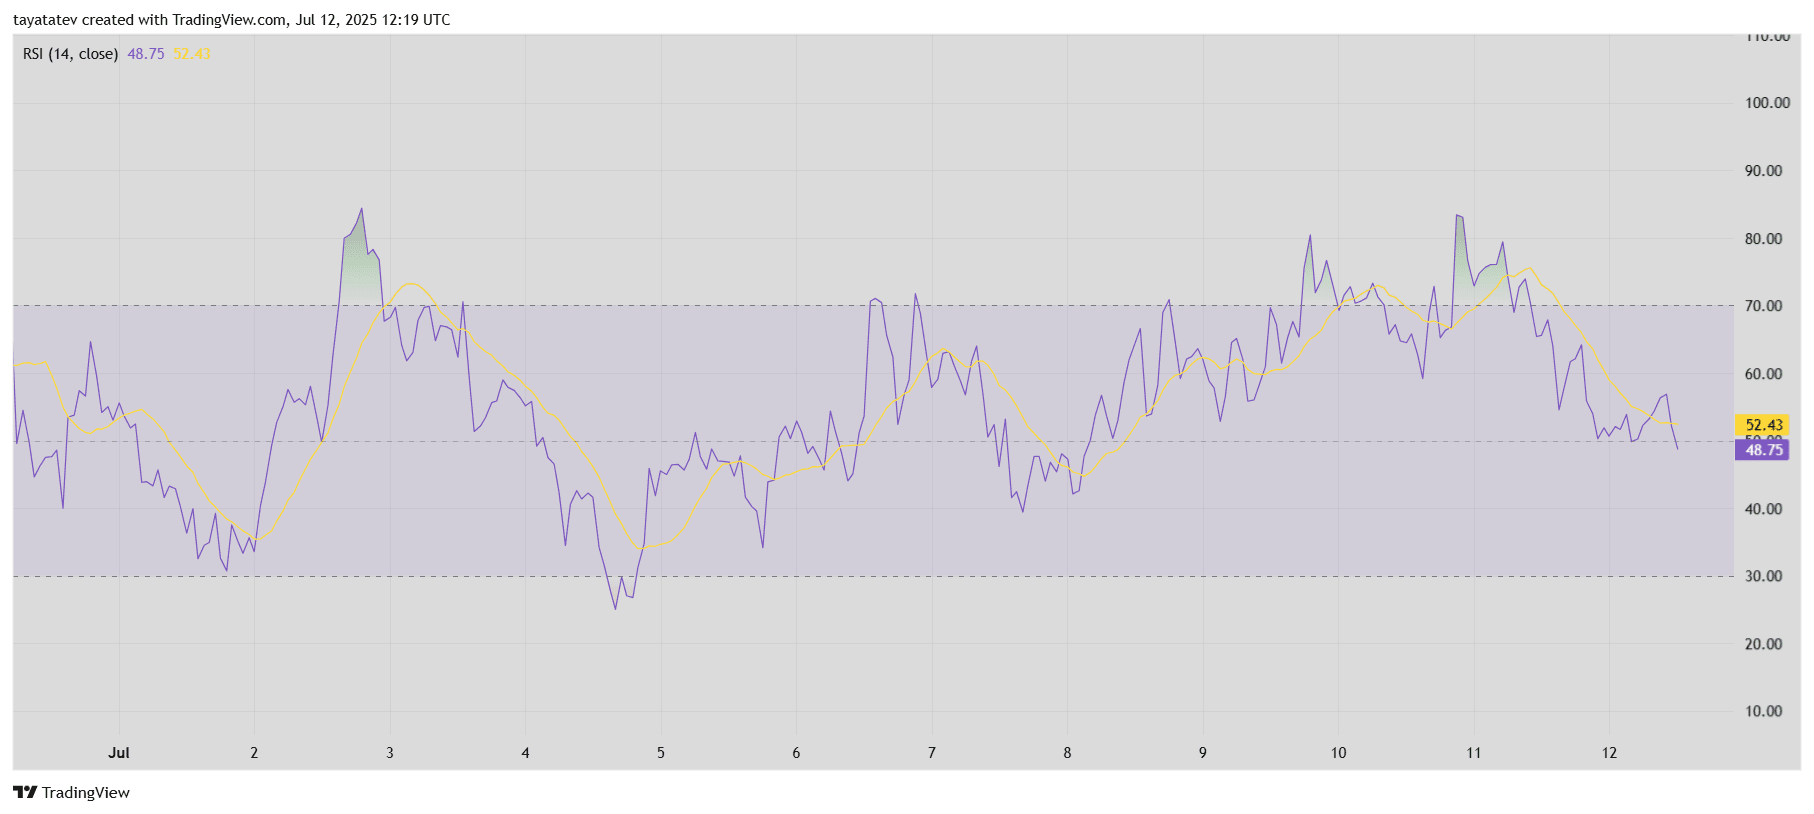
On July 12, the RSI value dropped to 48.75, while the 14-day RSI moving average stood at 52.43. This crossover suggests a weakening upward trend and reduced buying momentum. ETH has moved below its short-term average, reflecting a cooling in price strength after several bullish days.
Between July 9 and July 11, RSI stayed above 60 and approached 70 twice, showing strong buying pressure. However, since July 11, RSI gradually declined and crossed below the 50 mark. That level is often seen as a balance point between bullish and bearish strength.
The RSI falling below both its average and the neutral 50 level suggests a pause in the recent rally. If RSI continues downward without rebounding, it may indicate that traders are reducing exposure or locking in profits.
Ethereum DMI Suggests Weakening Trend Strength on July 12
This chart shows Ethereum’s Directional Movement Index (DMI) with 14-period settings, covering July 1 to July 12, 2025. The DMI uses three lines: the Positive Directional Indicator (+DI in blue), Negative Directional Indicator (−DI in orange), and the Average Directional Index (ADX in pink). This indicator helps assess trend direction and strength.
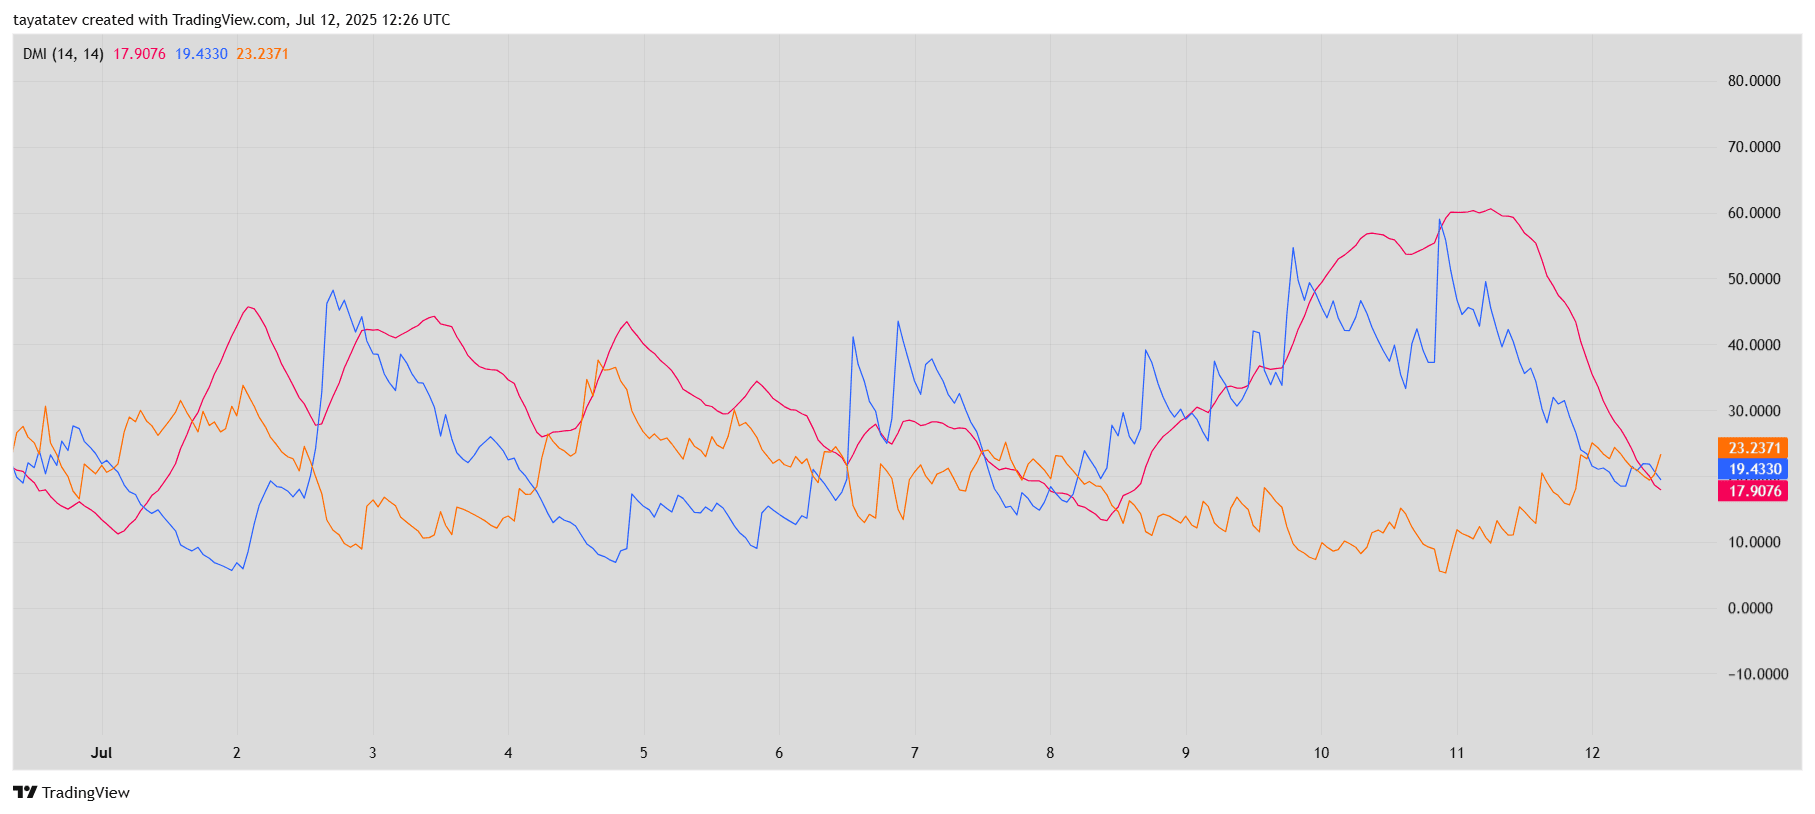
On July 12, the ADX stands at 17.90, the +DI at 19.43, and the −DI at 23.23. The ADX measures trend strength, not direction. A reading below 20 signals a weak or non-trending market. Since ADX has dropped under this threshold, it shows that Ethereum’s recent trend is losing momentum.
The −DI (orange line) now sits above the +DI (blue line), which indicates that sellers are slightly dominating. This crossover happened between July 11 and July 12, following a brief bullish period where +DI led. During the July 9–10 uptrend, +DI had risen above 50 and stayed elevated while ADX confirmed strong trend momentum above 60.
However, from July 11 onward, both +DI and ADX fell sharply. This shift reflects that buying pressure faded and the upward trend weakened. At the same time, the slight rise in −DI signals a mild increase in selling activity.
Currently, Ethereum shows no strong trend. The low ADX and crossover of directional indicators suggest short-term price movement could be sideways or range-bound.
دیدگاهتان را بنویسید