
XRP’s market capitalization surged to $164.47 billion, making it the third-largest cryptocurrency globally. This jump allowed it to overtake Tether (USDT) in the rankings. The price rally played a central role in pushing the altcoin higher, reflecting strong demand across the market.
Profit-Taking Intensifies as XRP Supply in Profit Tops 95%
As XRP’s price climbed, holders started to lock in gains. According to Santiment data, more than 95% of XRP’s circulating supply is now in profit. Historically, when this threshold is breached, markets often experience a correction. It marks a zone where investors frequently begin to sell, expecting a reversal.

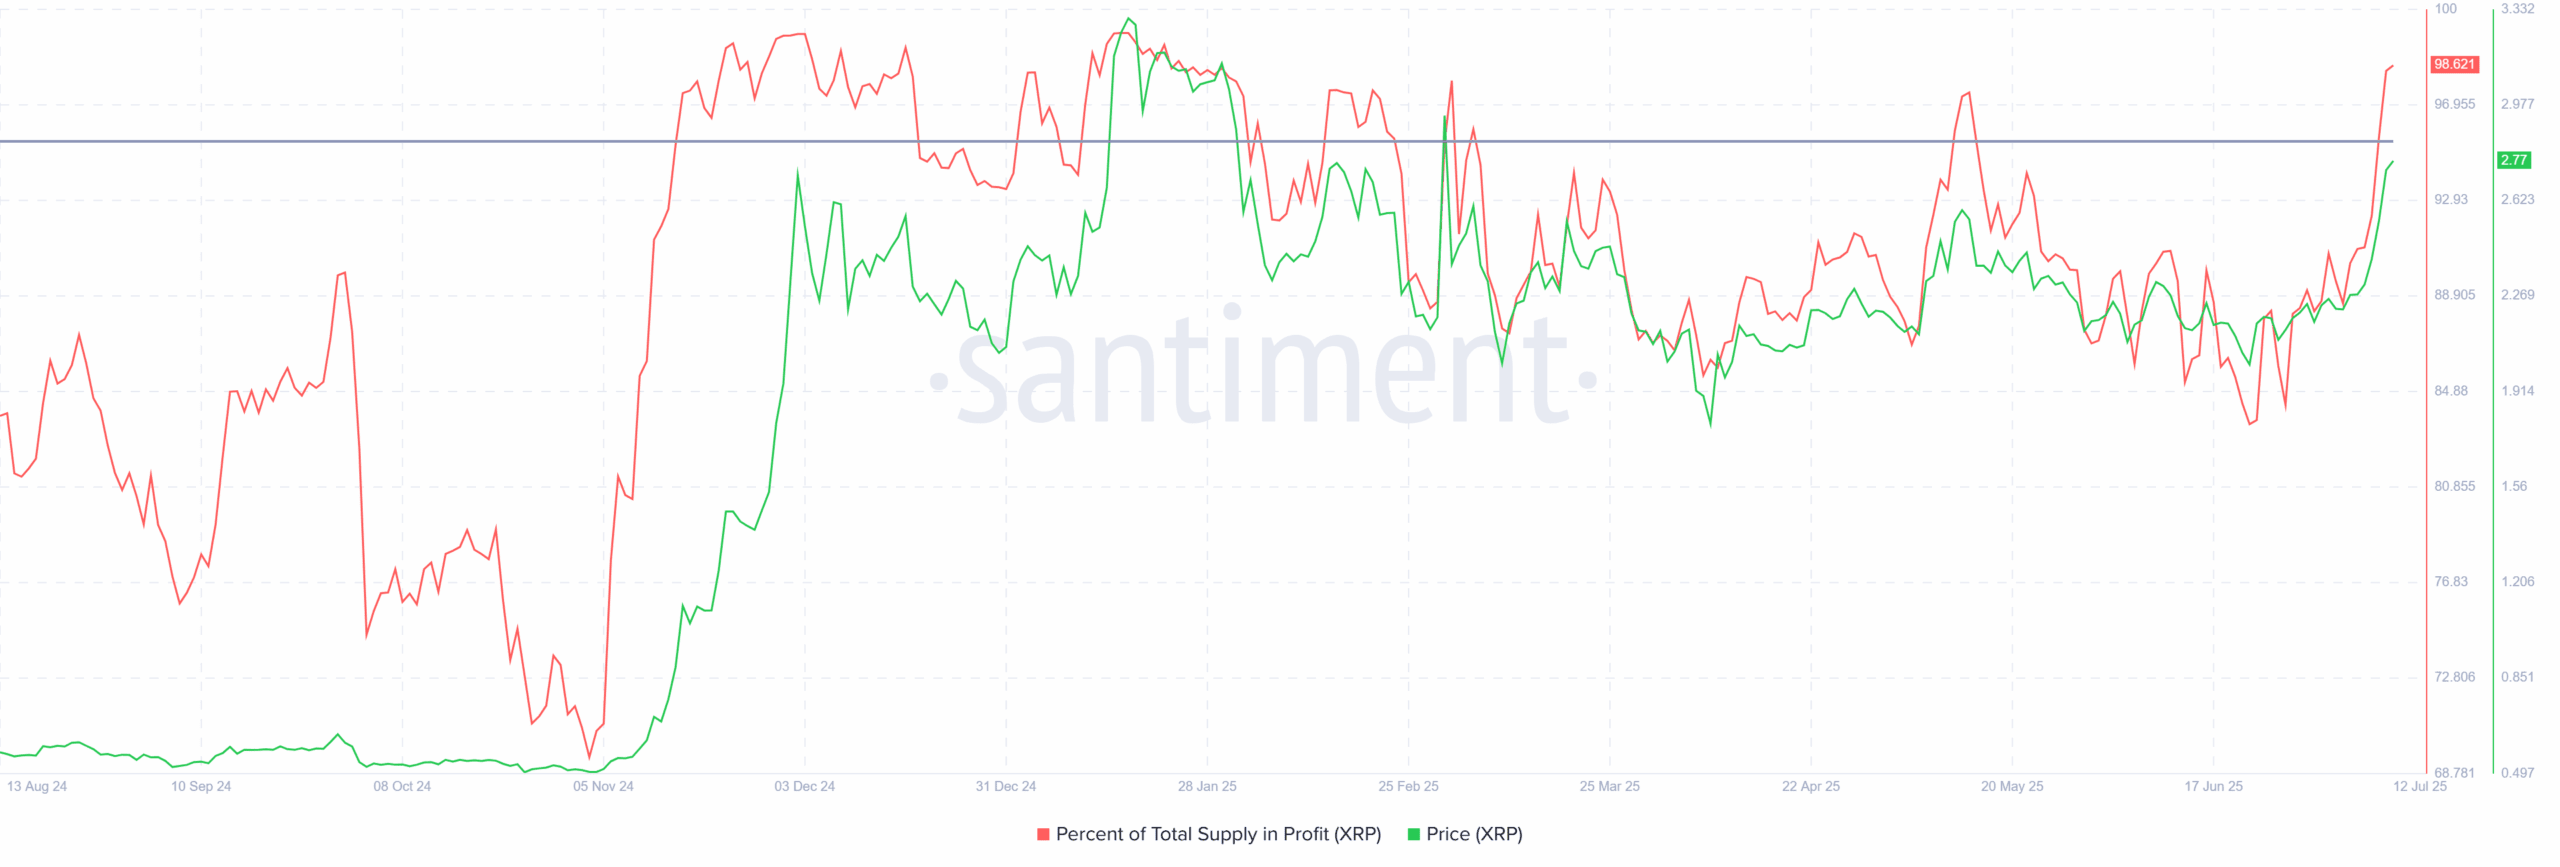
However, XRP has hovered around this level multiple times over the past year. Despite the high percentage of tokens in profit, the asset mostly traded sideways or faced minor corrections instead of sharp declines. This trend suggests the current situation might not guarantee a significant crash, even with heavy selling pressure.
Over 140M XRP Moved to Exchanges in 24 Hours
On-chain data points to rising caution among investors. In the last 24 hours, more than 140 million XRP tokens, worth over $387 million, were transferred to exchanges. This volume shift indicates active profit realization.
Glassnode’s net exchange position change chart confirms a strong inflow of XRP to trading platforms. When large amounts move to exchanges, it typically signals intent to sell, which can weaken market sentiment in the short term.
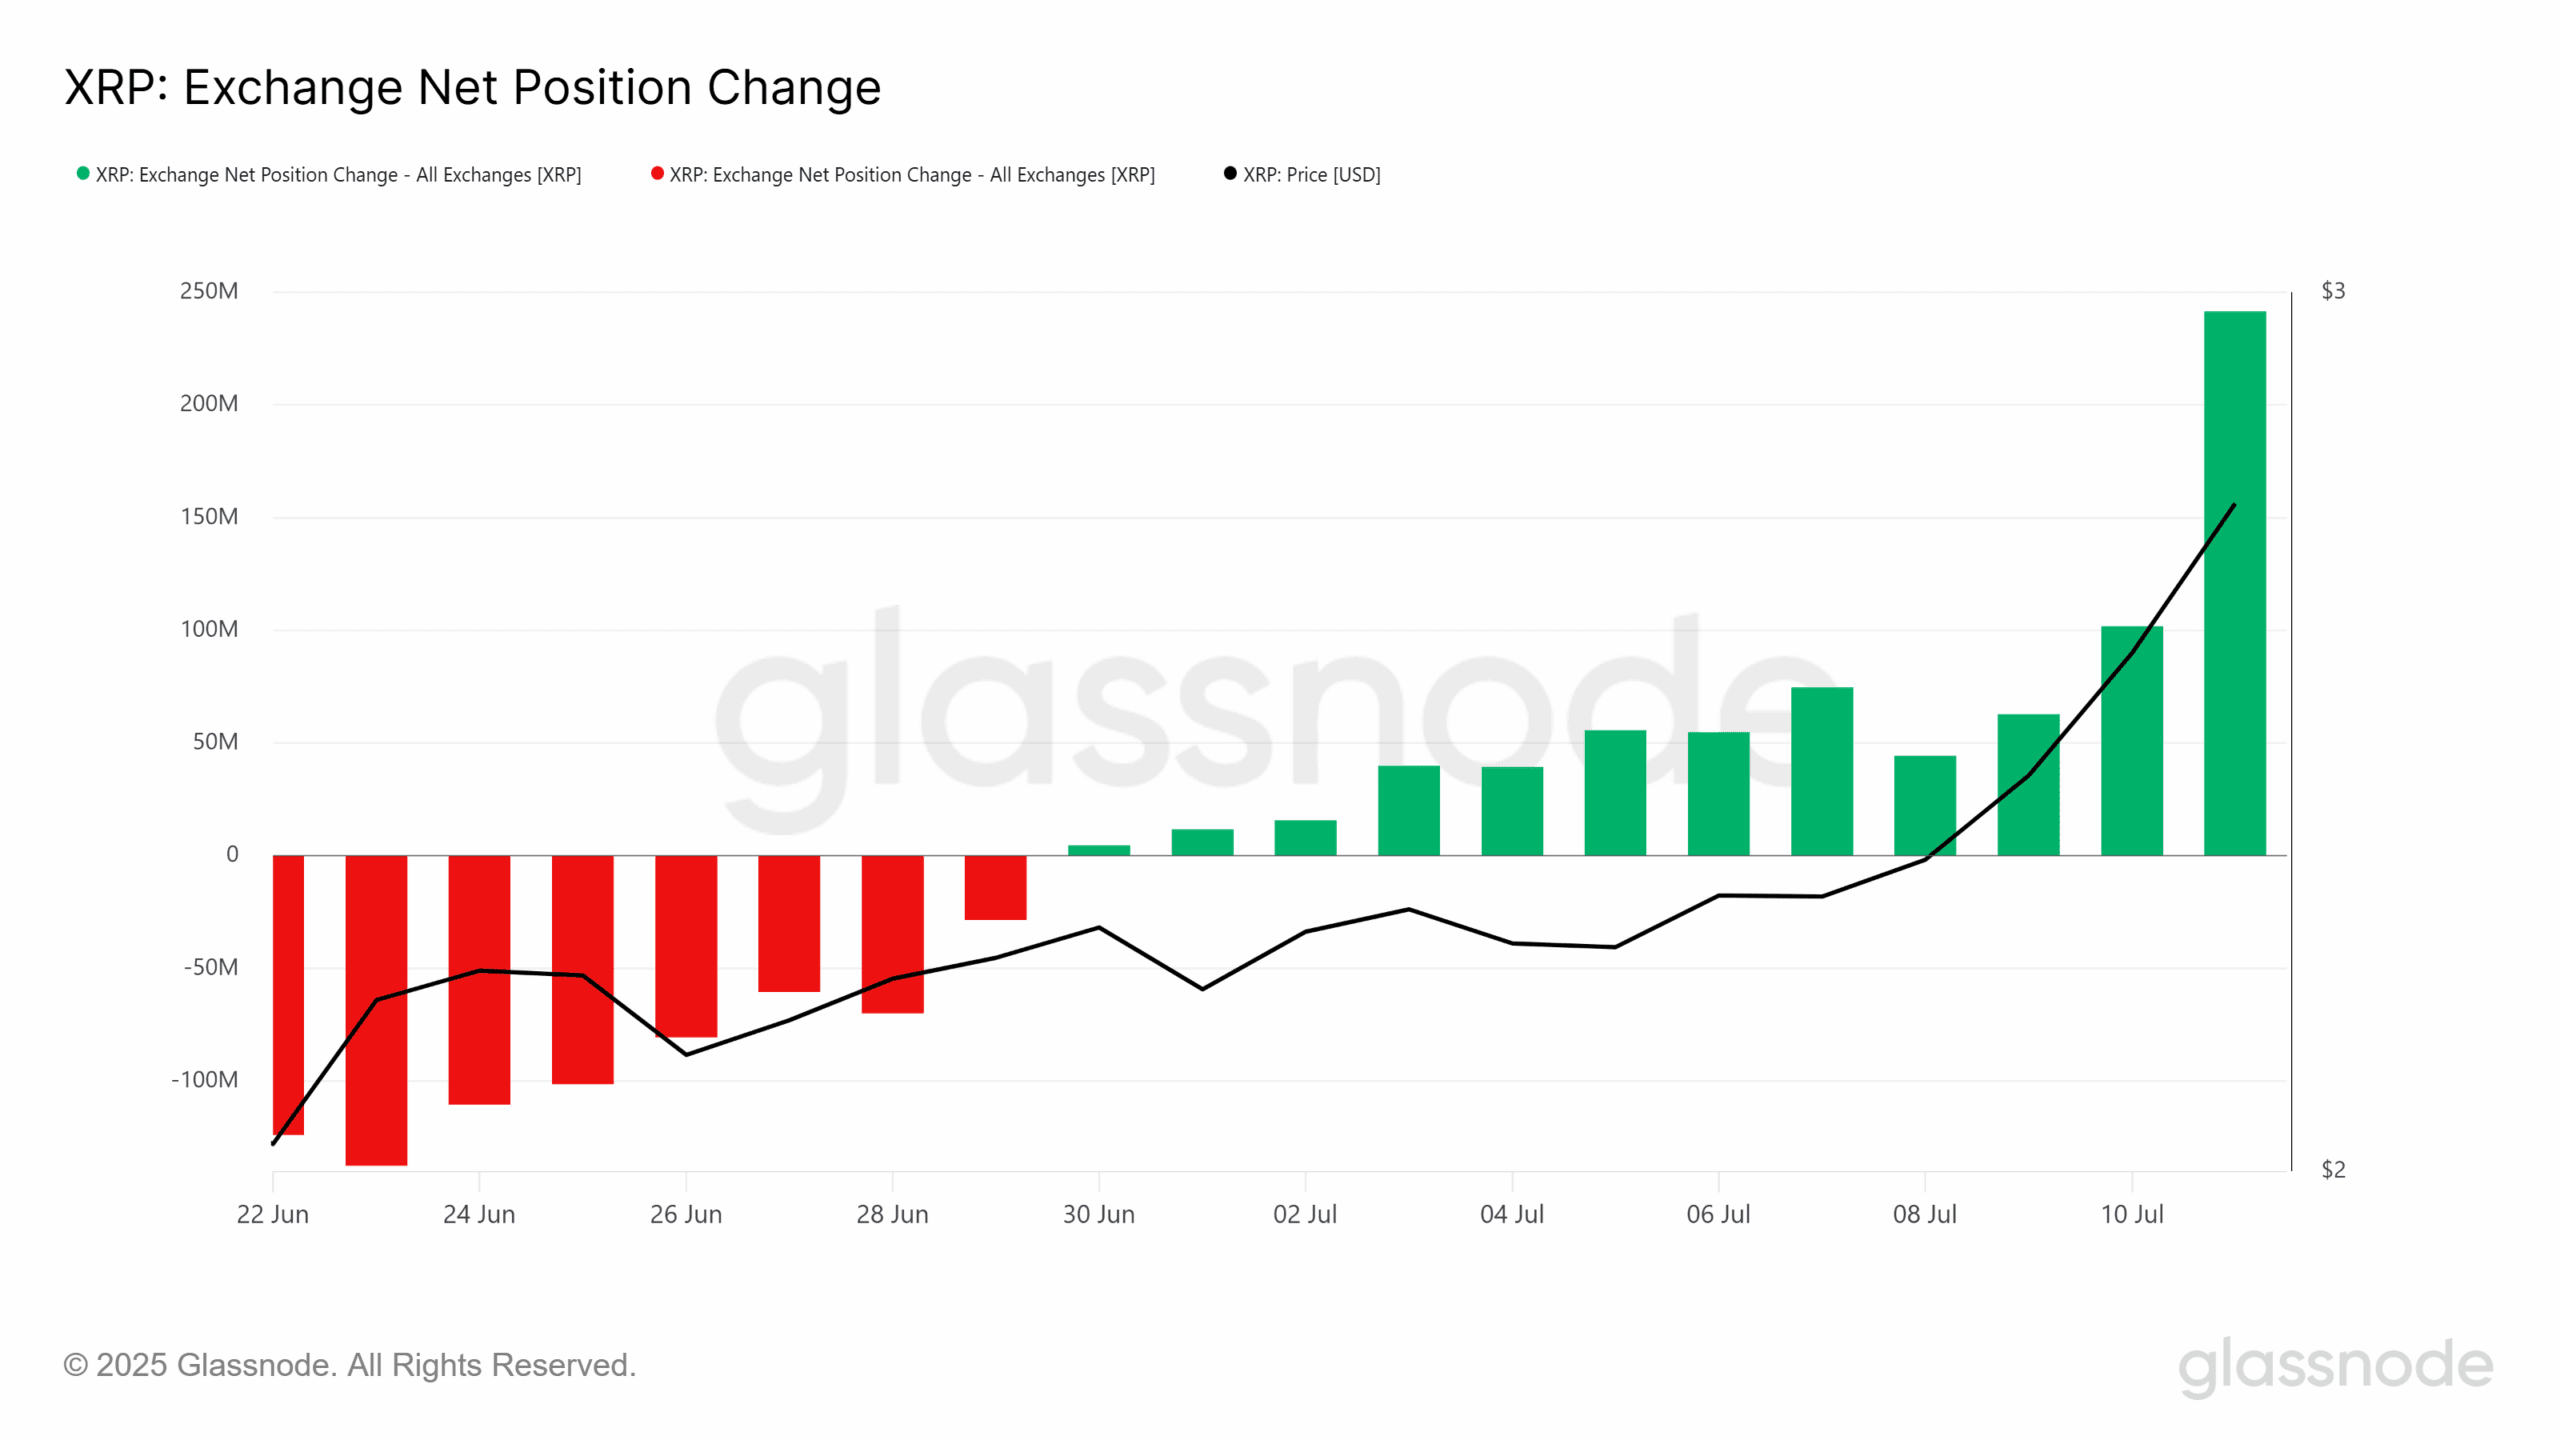
If selling continues at this scale, XRP may face a temporary pullback, despite its recent milestone.
XRP Forms Bullish Flag on July 13, Signals Possible 10% Price Jump
On July 13, 2025, XRP/ USDT formed a bullish flag pattern on the 1-hour chart for the XRP/USDT trading pair on Bybit. A bullish flag is a continuation pattern that shows a strong upward move (called the flagpole) followed by a brief consolidation phase with downward-sloping parallel trendlines (the flag), often leading to another upward breakout.
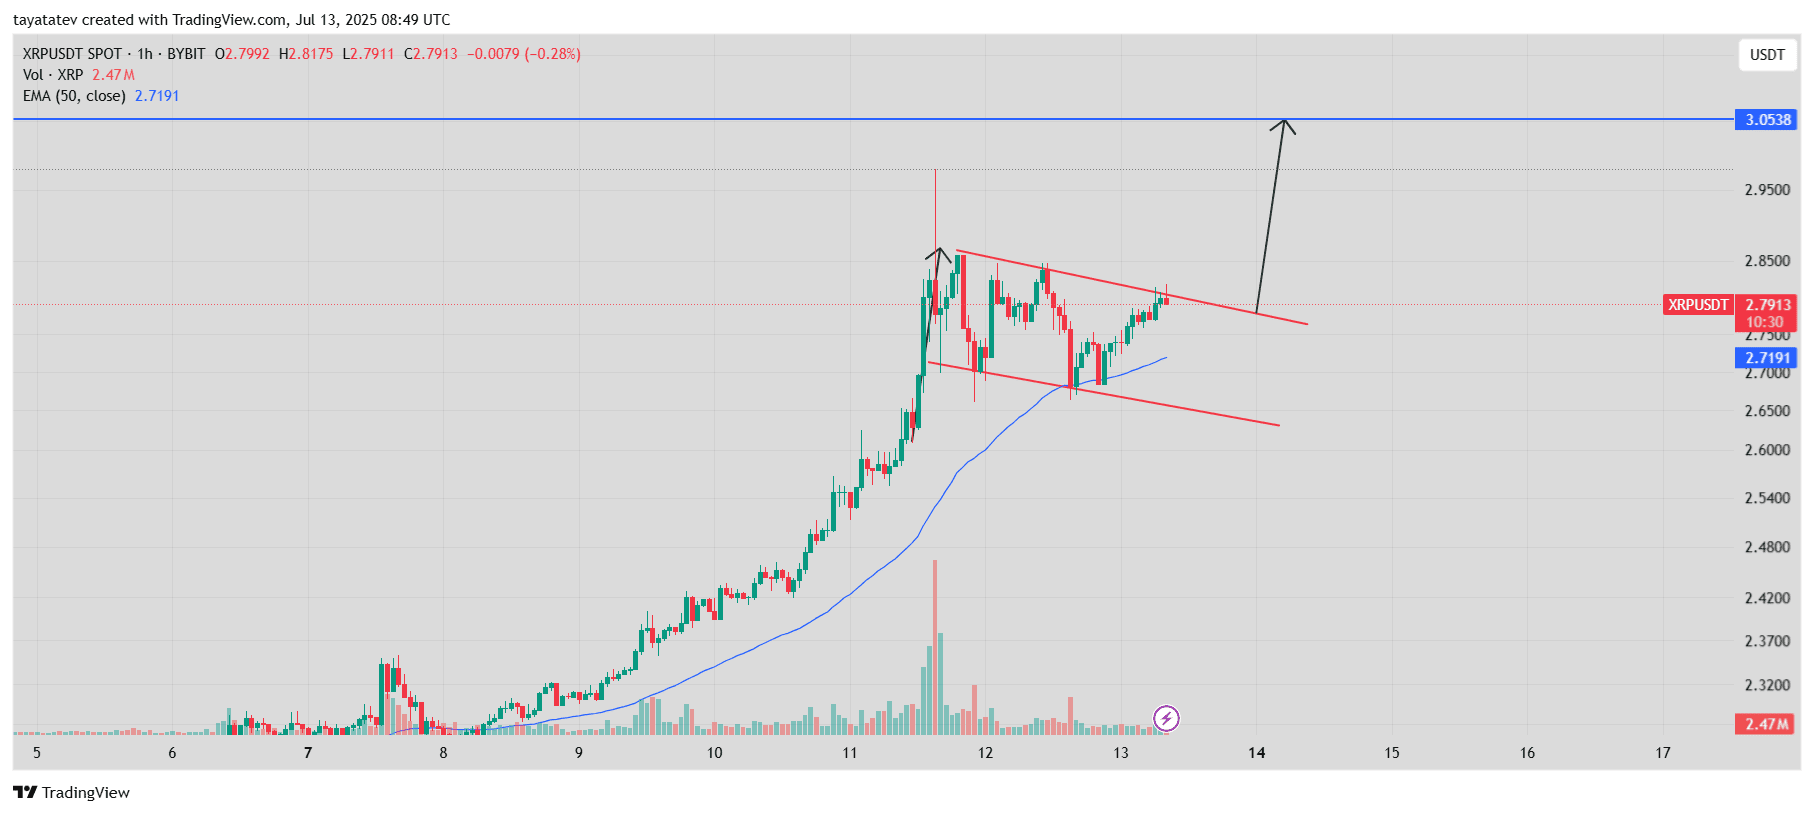
Right now, the flag appears to be close to breaking out. If confirmed, XRP’s price may climb nearly 10% from the current level of $2.79. This move could send XRP towards the next resistance near $3.05, marked clearly on the chart.
The pattern formed after a sharp rally that began around July 9. Since then, XRP has been moving inside two downward-sloping red lines, indicating temporary consolidation. However, XRP is now testing the upper boundary of this flag while staying above the 50-period Exponential Moving Average (EMA), which is at $2.71.
Volume has remained steady, and if it spikes during a breakout, it would confirm bullish momentum. The clean flag structure, rising EMA, and strong rally leading into the pattern suggest that if XRP closes a few candles above the upper trendline, a breakout is likely.
If that breakout happens, traders may target the $3.05 level, which is just over 9.6% higher than the current price.
XRP Trend Weakens as DMI Signals Fading Momentum
On July 13, 2025, the Directional Movement Index (DMI) chart for XRP/USDT shows a shift in momentum, with the uptrend losing strength. The +DI line (blue), which tracks bullish pressure, remains above the –DI line (orange), suggesting buyers are still slightly in control.
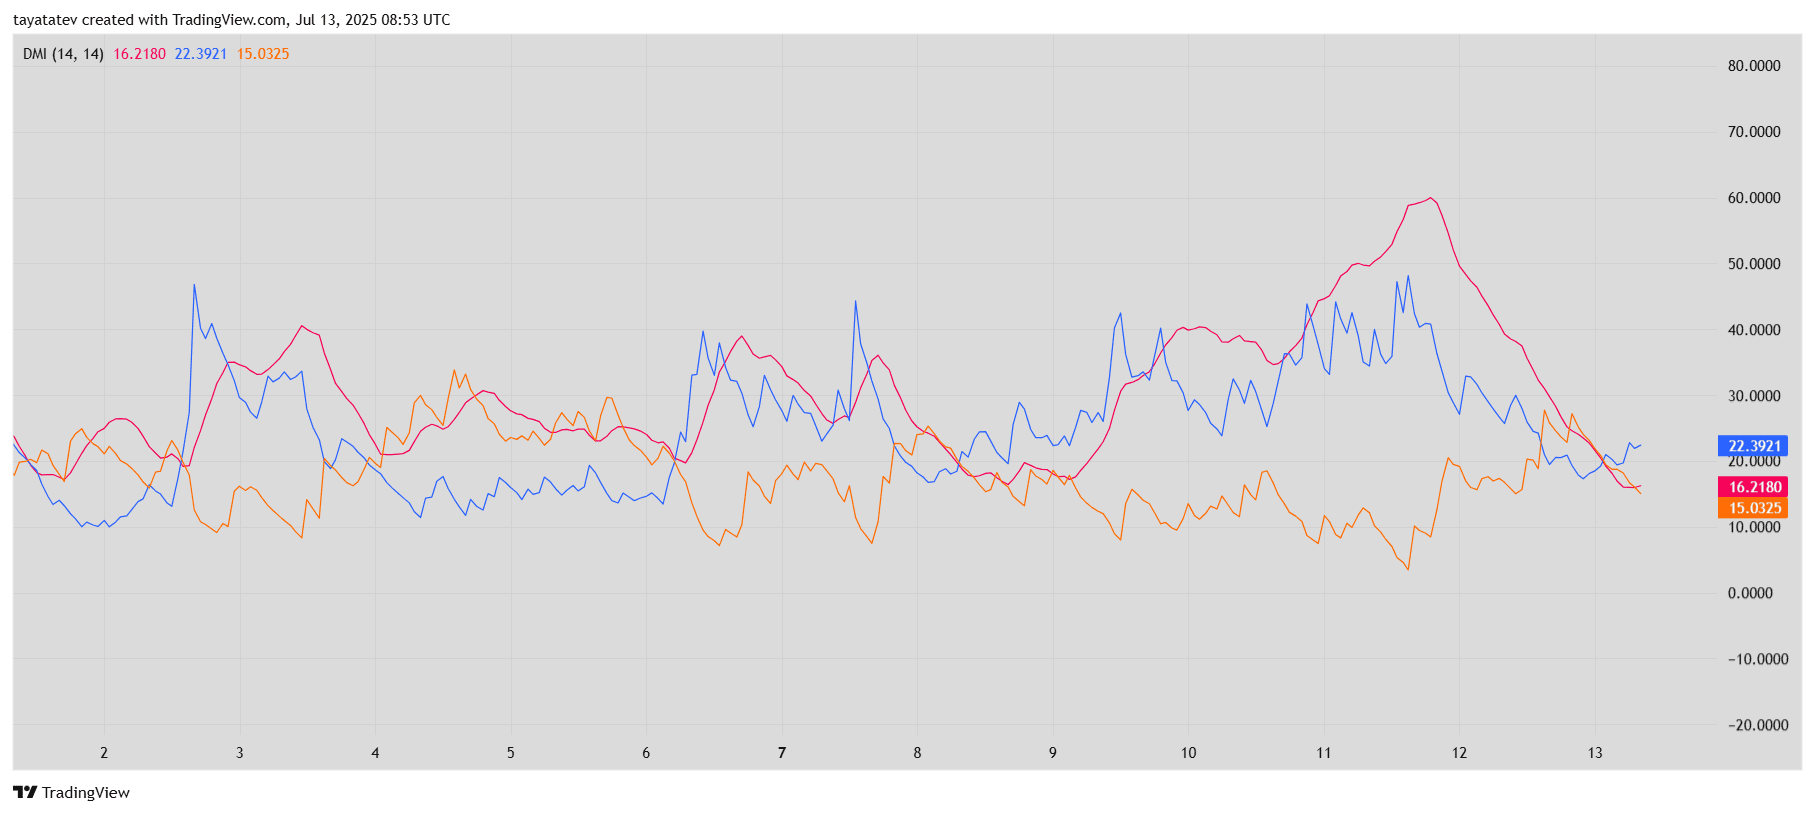
However, the Average Directional Index (ADX), shown in red, has dropped steeply from above 60 to 16.21. This sharp decline in ADX indicates that the strength behind the recent bullish trend is fading fast. Although sellers have not yet taken over—since the –DI has not crossed above the +DI—the narrowing gap and falling ADX suggest that the market may be entering a consolidation phase. This means XRP could move sideways in the short term unless a fresh directional breakout occurs. As of now, the chart shows no strong trend in either direction, but it leans slightly bullish with weakening momentum. The next clear signal would require either a crossover between the DI lines or a renewed rise in ADX to confirm new trend strength.
XRP RSI Chart Signals Mild Recovery With Room to Grow
On July 13, 2025, the 14-period Relative Strength Index (RSI) for XRP/USDT showed a value of 57.06, indicating a slight bullish bias but staying well below overbought territory. The RSI measures the strength and speed of recent price movements to assess whether an asset is overbought or oversold. A level above 70 signals potential overbought conditions, while a drop below 30 points to oversold territory.
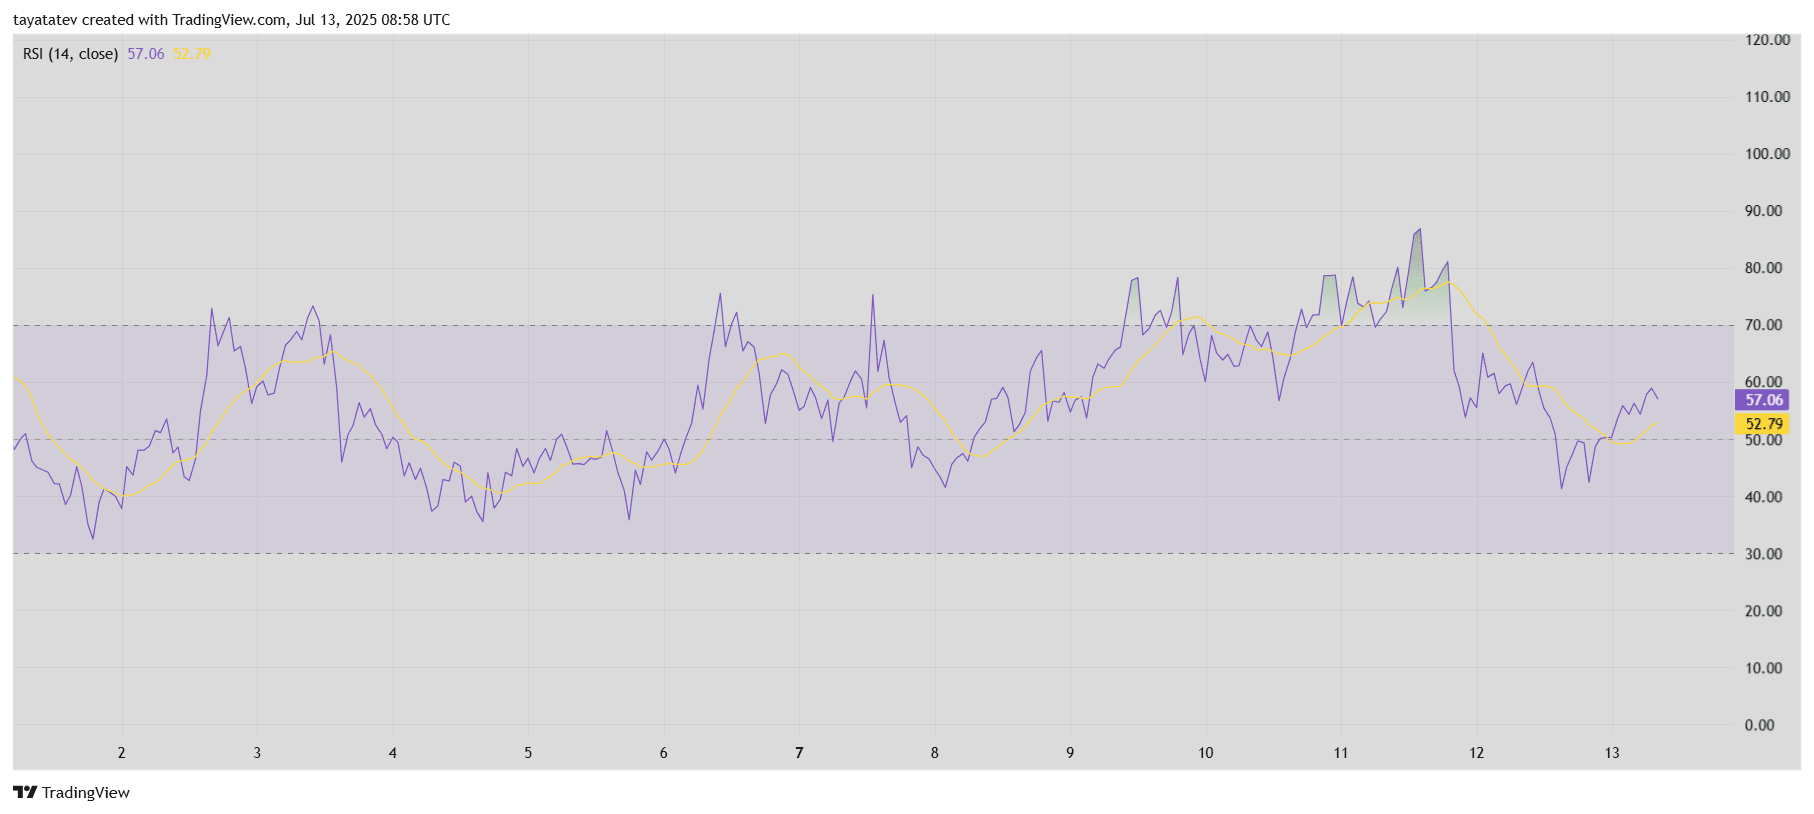
XRP’s RSI recently rebounded after dipping below 50, a neutral midpoint. That dip occurred during a short-term pullback in price, but the bounce suggests renewed buyer interest. The yellow line on the chart, which represents the RSI-based moving average at 52.79, has now turned upward, supporting the view that momentum is shifting back in favor of bulls.
As of now, the RSI remains in a healthy range and shows no sign of exhaustion. This leaves room for XRP to continue climbing without triggering immediate overbought warnings. The smooth recovery in RSI aligns with the bullish flag breakout potential spotted on the price chart, confirming that momentum is gradually returning.
XRP MACD Flashes Fresh Bullish Crossover on July 13
The Moving Average Convergence Divergence (MACD) indicator for XRP/USDT showed a new bullish crossover. The MACD line (blue) has just moved above the signal line (orange), with the MACD reading at 0.0148 and the signal at 0.0103. This crossover indicates a potential shift toward bullish momentum after a short correction phase earlier this week.
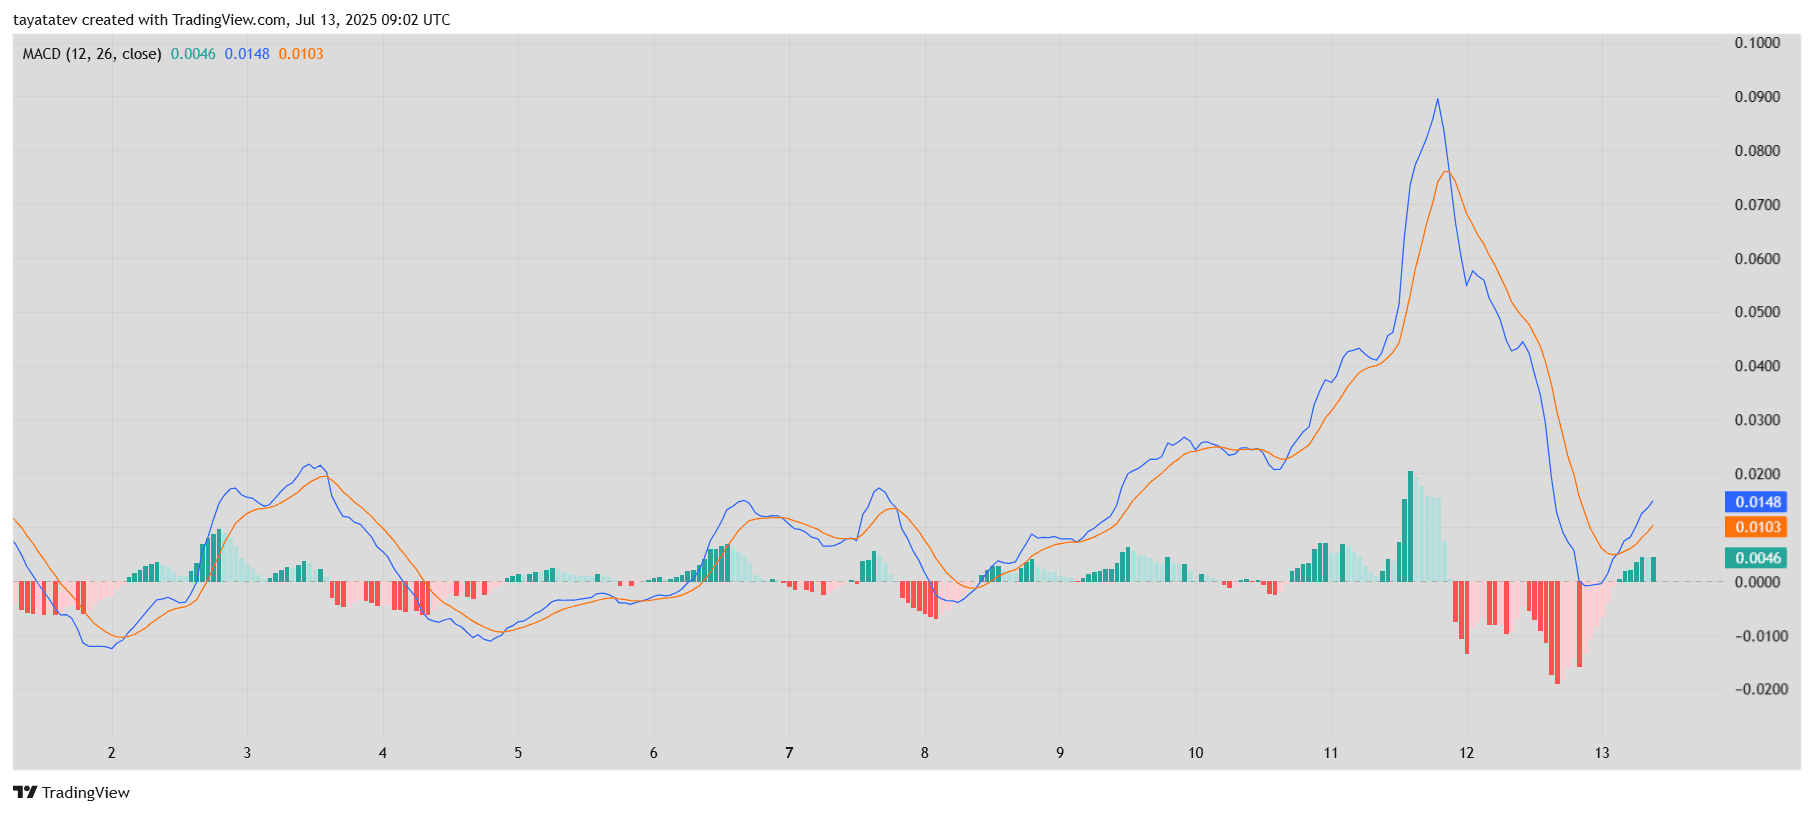
The histogram, which visualizes the distance between the MACD and signal lines, has turned positive again after staying red since July 12. That shift shows buyers are regaining control after recent weakness. The steep decline from the peak on July 11 has now slowed, and the MACD’s current direction suggests momentum may rebuild.
This setup often acts as an early indicator of upward price action, especially when it follows a deep retracement like the one seen from July 12. However, the current MACD values remain close to the zero line, which means the strength of the new bullish wave is still developing. If the gap between the MACD and signal lines widens further, it would confirm stronger buying pressure.
دیدگاهتان را بنویسید