
Bonk’s launchpad, letsbonk.fun, recorded the highest share of Solana’s launchpad revenue on July 15, 2025. It made up 58.95% of the total. In comparison, Pump.fun contributed 25.95%, and Raydium followed with 14.87%. Other launchpads contributed less than 1%.
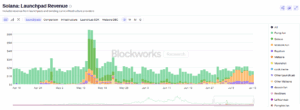
This was the first time letsbonk.fun has outperformed Pump.fun by such a wide margin. A month ago, Pump.fun had the lead. Now, Bonk’s launchpad is seeing more users and more capital flowing into its token launches.

Token Launches on Bonk Surpass All Competitors
On the same day, letsbonk.fun deployed 14,804 new tokens followed by Pump.fun’s 9,673 token and Moonshot’s 2,247.
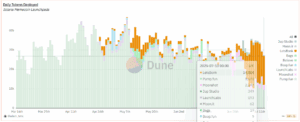
These numbers show that Bonk is leading not just in revenue but also in actual launches. More creators are choosing Bonk’s bonding curve system to launch tokens on Solana. This also means that more bonding curve fees are being generated through its platform.
Letsbonk.fun uses bonding curve mechanics that uses half of all launch fees to buy and burn BONK. This reduces the circulating supply over time. As more launches happen, more tokens get removed from the market.
The growing use of Bonk’s launchpad is directly linked to price support through this buy-and-burn mechanism. Specifically, more creators are launching tokens through its launchpad, more buyers are joining early and more capital is flowing through the platform. This is pattern is growing the Bonk ecosystem.
As launchpad activity has increased, Bonk’s price has also increased. On July 15, it traded at $0.00002815 — a 4.5% gain in 24 hours. Bonk price has gained 24.65% over 7 days.
Trading volume reached $1.35 billion, while market cap rose to $2.27 billion. Circulating supply stood at 80.87 trillion BONK.
Chart Breakout Confirms Strong Momentum
The BONK to USD chart shows a clear breakout from a falling channel. The breakout began in early July. Price has continued to rise with strong volume.
As of July 15, the Relative Strength Index (RSI) on the daily chart was 75. This level shows strong momentum. It also indicates that the token is now in overbought territory.
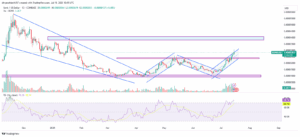
RSI at 75 often leads to a short-term pause or correction. But if volume stays high, price can still continue higher.
Moreover, BONK is now testing a key resistance zone. This area blocked price rallies in March and June this year. BONK price failed to close above $0.000030 during those moves. To break this zone, it must close above $0.000030 with strong daily volume. If that happens, the next price target could be around $0.000045 — the high from November 2023.
If the token fails to break resistance, it may drop back to $0.000022–$0.000023, which is the support area from early July.
BONK Outpaces Other Solana Tokens This Week
Bonk outperformed most Solana-based tokens over the past seven days. As noted, the token gained 24.65%, while Pump.fun (PUMP) dropped 13.34%.

Solana (SOL) posted a modest increase of 5.17%, and Render (RENDER) rose by 16.24%. Pudgy Penguins (PENGU) showed a larger gain of 115.83%, but its low trading volume puts it outside the same market tier. Among high-volume assets, Bonk delivered one of the strongest performances across the Solana ecosystem.
دیدگاهتان را بنویسید