
The chart shared by Peter Brandt on July 16, 2025, displays the total crypto market cap excluding Bitcoin. The price data reflects weekly candles, covering movements from mid-2016 to mid-2025. The market cap recently climbed to $1.39 trillion, according to TradingView data.
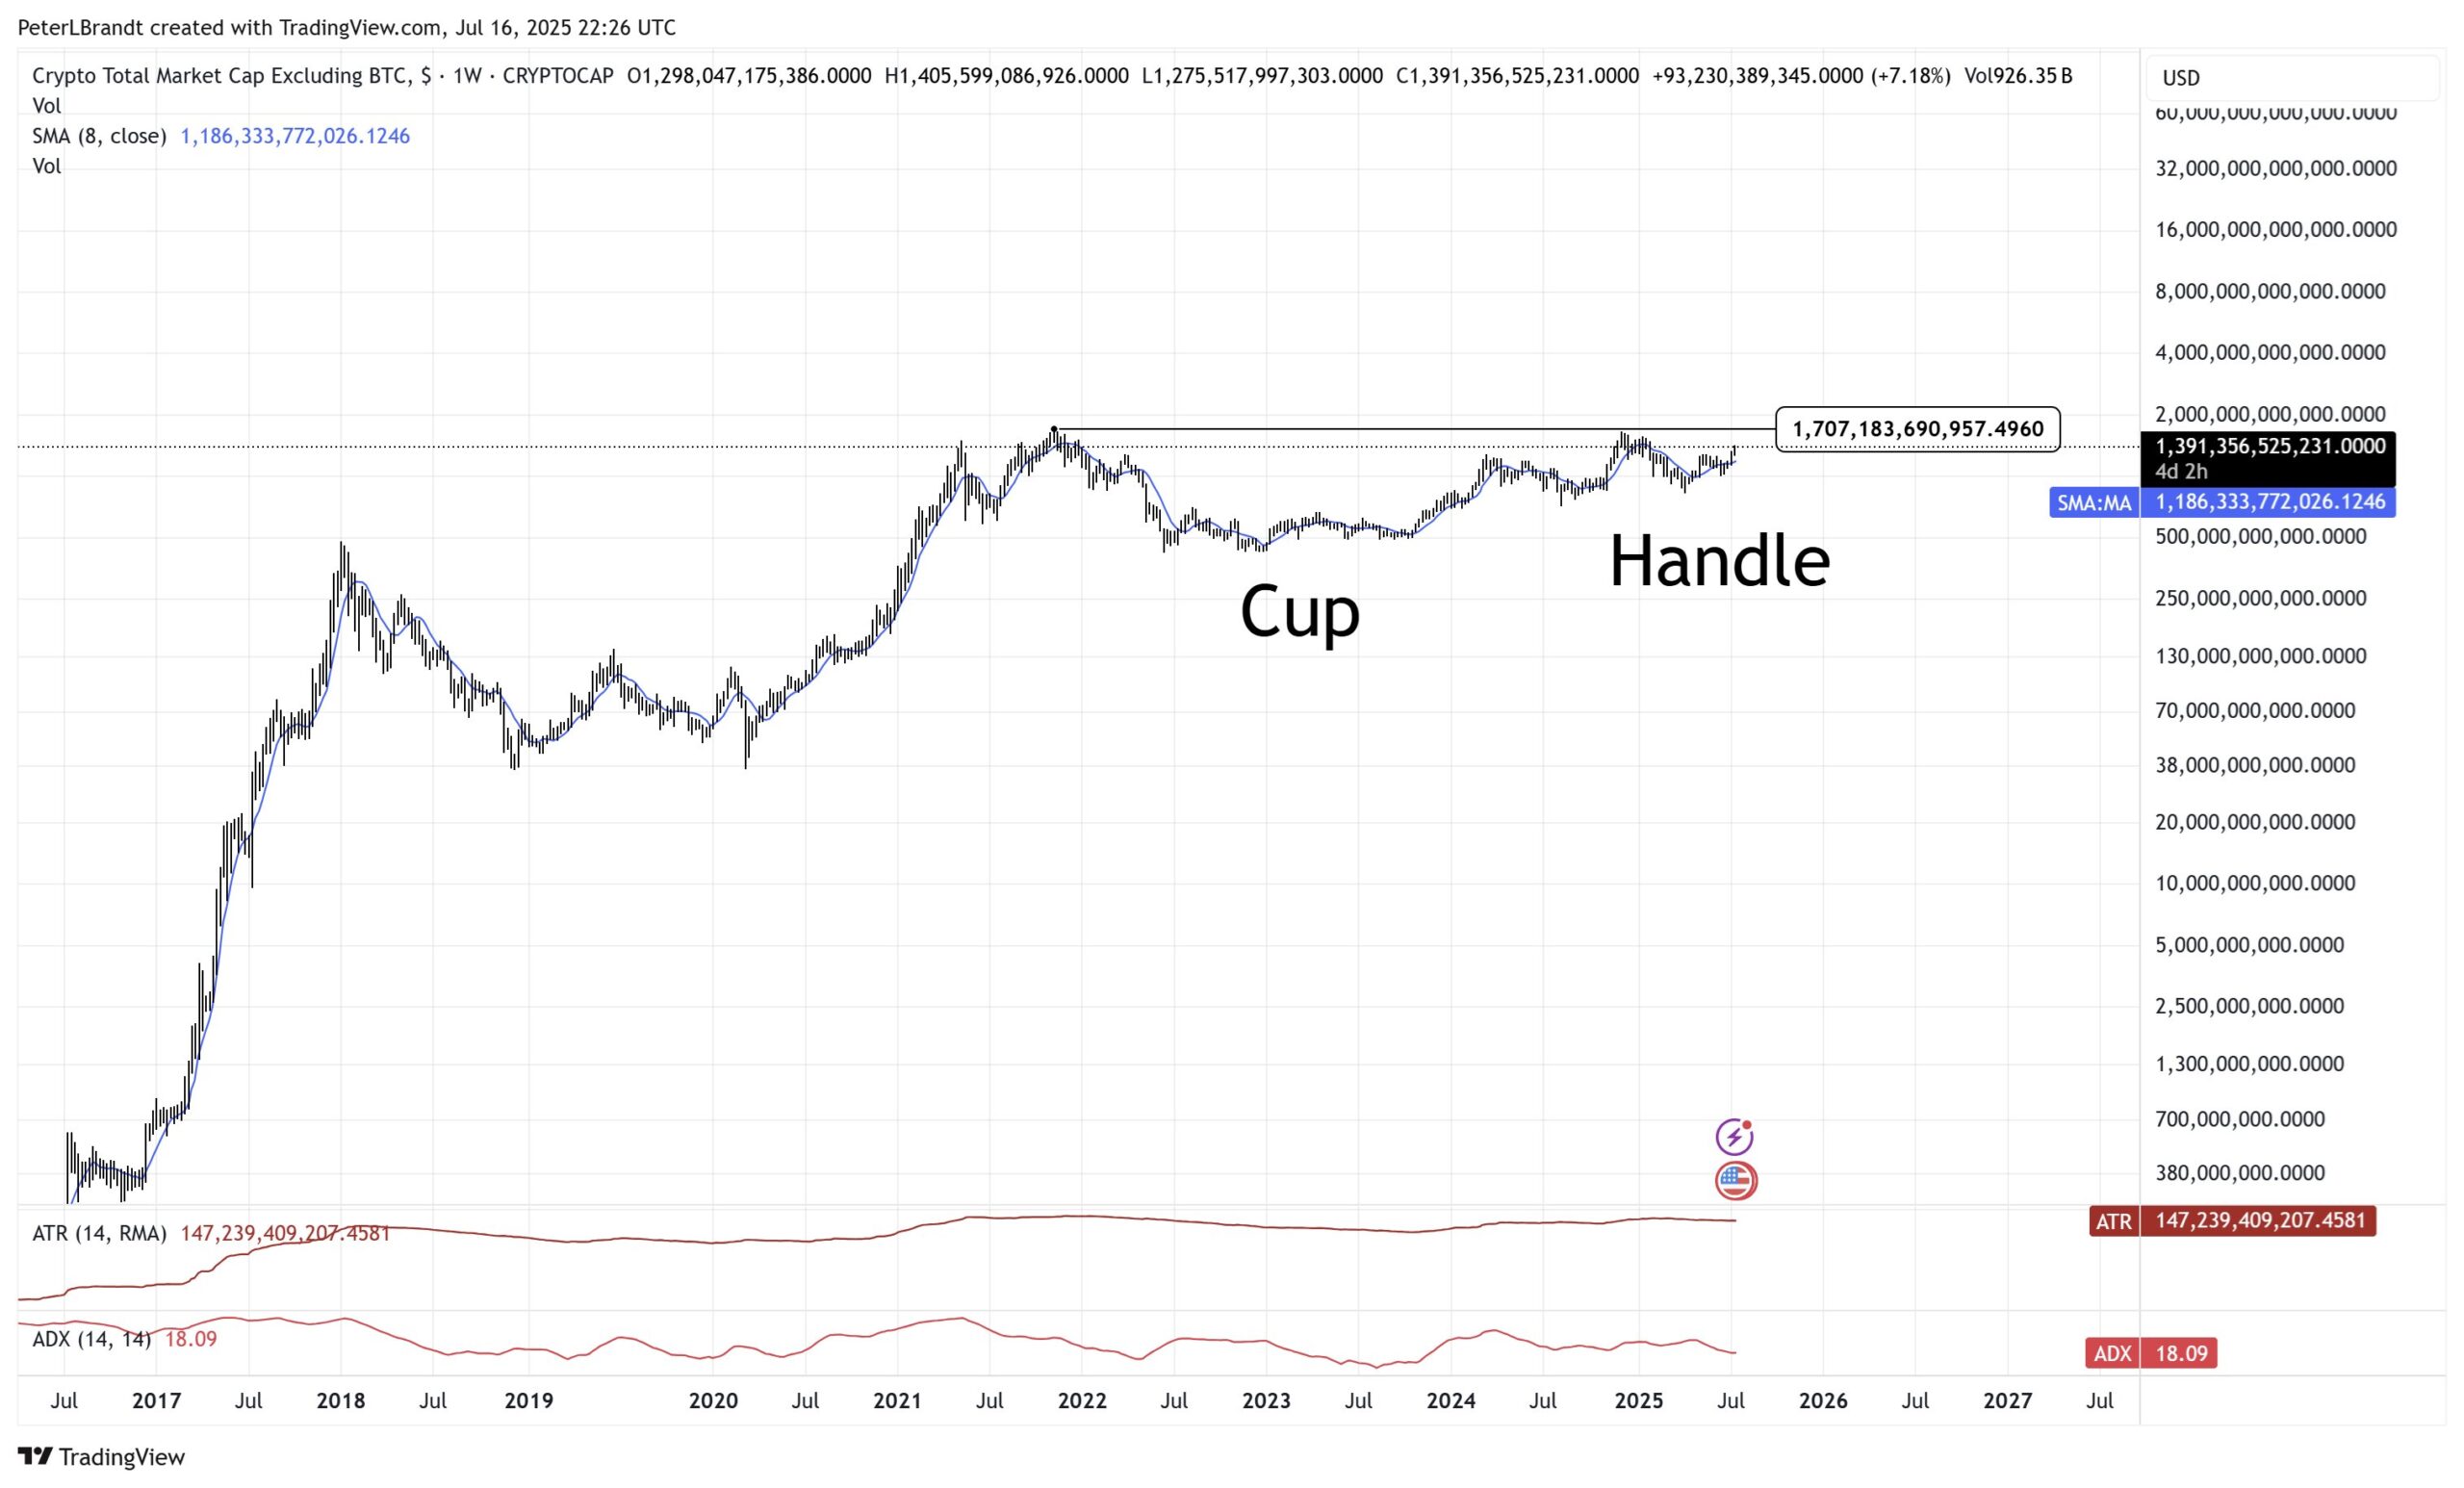
This structure is often seen as bullish, signaling a possible breakout once the handle completes.

Peter Brandt Signals Altcoin Season
Brandt’s analysis implies altcoins may lead the next major rally. His focus on the total crypto market cap excluding Bitcoin confirms that this chart tracks altcoins only. He marked the breakout level near $1.7 trillion, suggesting a sustained move above that resistance could kick off a new altcoin cycle.
The chart includes a simple moving average (SMA-8), which currently trends upward and sits below the current market cap value, indicating upward momentum. The ATR (Average True Range) is at $147 billion, showing relatively high volatility. Meanwhile, the ADX (Average Directional Index) sits at 18.09, signaling a weak trend that may be gathering strength.
Altcoins Target $2.78 Trillion as TOTAL3 Breaks Out of Bullish Pattern
Meanwhile, altcoins are flashing a major breakout signal as the TOTAL3 chart—representing the market cap of all cryptocurrencies excluding Bitcoin and Ethereum—confirms a textbook cup-and-handle pattern on the weekly timeframe.
The rounded “cup” formed over a multi-year bottom between late 2021 and early 2024. It shows a long period of accumulation and recovery from the previous cycle’s peak. After reclaiming the midpoint of the structure in early 2024, altcoins entered a sideways phase, creating a “handle” defined by a series of lower highs and support retests near $800 billion.
That handle structure has now broken. The chart shows multiple successful retests of the 50-week and 100-week moving averages, each marked by strong bullish wicks and rising volume. These reactions confirmed the base of the handle before buyers drove TOTAL3 above the downtrend resistance.
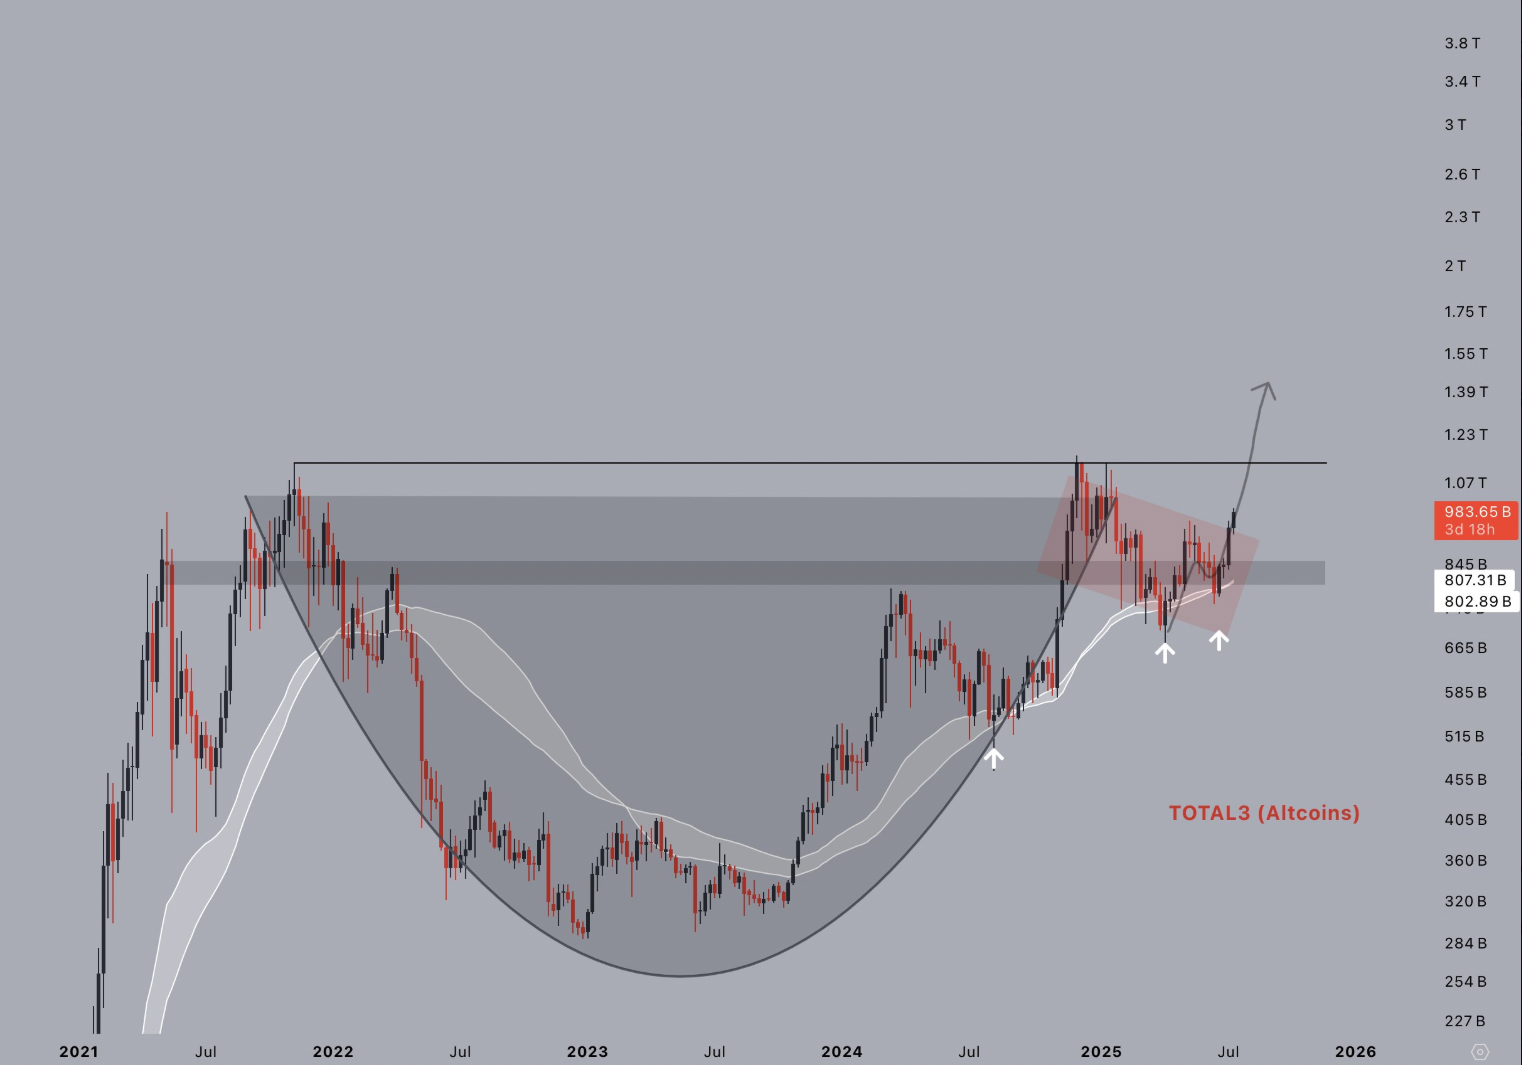
As of July 17, the market cap has pushed toward $984 billion and is approaching the critical neckline resistance near $1.1 trillion. Once this zone breaks, the pattern’s measured target points to $1.98 trillion. However, broader projections place the altcoin market cap as high as $2.78 trillion—marking a 180% rally from the 2023 lows.
In a post on X, trader Jelle confirmed this view, stating:
“Altcoins have broken out from the multi-year cup and handle. One last hurdle to overcome, but once this clears $1.1 trillion, everything goes nuts.”
The breakout structure shows strong support. First, the moving averages remain tight. Then, price momentum continues to rise. The handle’s rejection zone flipped into support. Together, these factors strengthen the bullish continuation signal. Now, altcoins face a clear path to retest previous highs. But they must hold above the breakout zone in the coming sessions.
دیدگاهتان را بنویسید