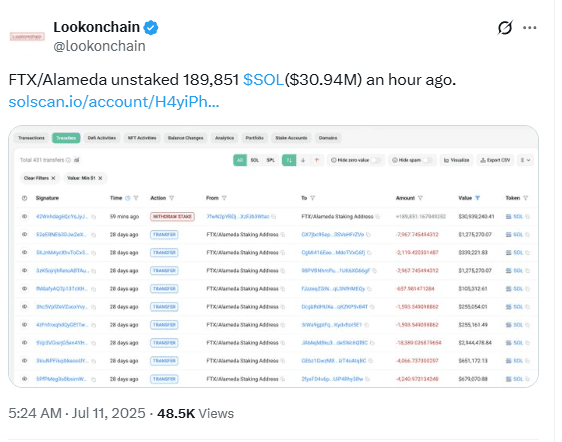
FTX unstaked Solana tokens worth over $31 million on July 11. The total number of tokens removed from staking was 189,851 SOL, according to on-chain data from Lookonchain.
The tokens were valued at $30.94 million at the time of transfer. They were moved from a validator address connected to the collapsed exchange. FTX has executed similar transactions before, but this release happened during a major crypto rally.

Bitcoin crossed $118,000 the same day. Ethereum also climbed back above $3,000. Solana traded near $163 when the FTX unstaked Solana transaction occurred. The timing raised concerns about possible effects on Solana price. One X user said,
“Sending it into the market can bring more uncertainty for SOL.”
Solana Tokens Could Be Used for FTX Creditor Payments
The 190,000 SOL now sit in a wallet controlled by the exchange. FTX might distribute the tokens as part of its ongoing creditor repayment process. The estate is working to return roughly $5 billion to users affected by the collapse.
If the unstaked Solana tokens are sent directly to creditor wallets, it could reduce the need for bulk sales. However, if creditors decide to sell, this could increase sell pressure. FTX previously made a larger Solana move earlier this year. In that case, the $236 million unlock briefly pushed the Solana price lower.

FTX unstaked Solana in smaller amounts before, but Friday’s transfer came at a time of growing investor activity. The transaction was confirmed by Lookonchain, which regularly tracks blockchain activity tied to the exchange.
FTX Bankruptcy Case Faces Obstacles From Chinese Creditors
FTX’s bankruptcy process includes claimants from dozens of countries. But now, Chinese creditors face delays. FTX proposed freezing claims from 49 jurisdictions. The estate cited local restrictions on crypto transactions.
According to the FTX Recovery Trust, “Certain creditors… reside in jurisdictions that continue to have laws and regulations that restrict cryptocurrency transactions.” China represents 82% of that group. Overall, those countries make up just 5% of the total claims.
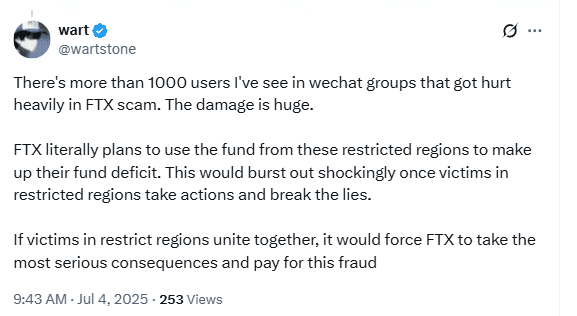
In 2021, China banned crypto trading and related platforms. But many Chinese residents still hold U.S. dollar balances overseas. One user said in a WeChat group,
“There’s more than 1,000 users I’ve seen… that got hurt heavily in the FTX scam.”
The estate’s legal team is now dealing with cross-border restrictions and bankruptcy court rules. This may affect how quickly assets like the Solana tokens can be distributed or sold.
Solana Price Reaction Remains Uncertain as Tokens Sit in Wallet
After FTX unstaked Solana, the market watched closely for next steps. The unstaked tokens have not yet been sent to exchanges or creditors. Solana price did not react strongly after the move, but similar actions in the past triggered short-term volatility.
The 190,000 SOL release is smaller than March’s 236,000 SOL transfer. That larger movement caused a temporary dip in Solana price. Some observers now expect lower market impact, since daily Solana trading volumes exceed $2 billion.
Still, analysts continue to track wallet activity linked to the exchange. FTX’s actions often draw attention because of the potential for sudden liquidity shifts. Legal filings show that token distributions may continue depending on court orders and internal policies.
The Solana tokens remain untouched since the unstake. Market participants are waiting to see if they will go to creditor wallets or exchanges. FTX has not issued a public statement on the next step for the 190,000 SOL.
Solana Chart Shows Bullish Flag Formation After July Breakout
The Solana SOL/ USDT daily chart created on July 11, 2025, shows a breakout from a bullish flag pattern. This formation typically appears after a strong upward move, followed by a downward-sloping consolidation. A bullish flag pattern suggests that the asset may continue moving upward after the consolidation phase ends.
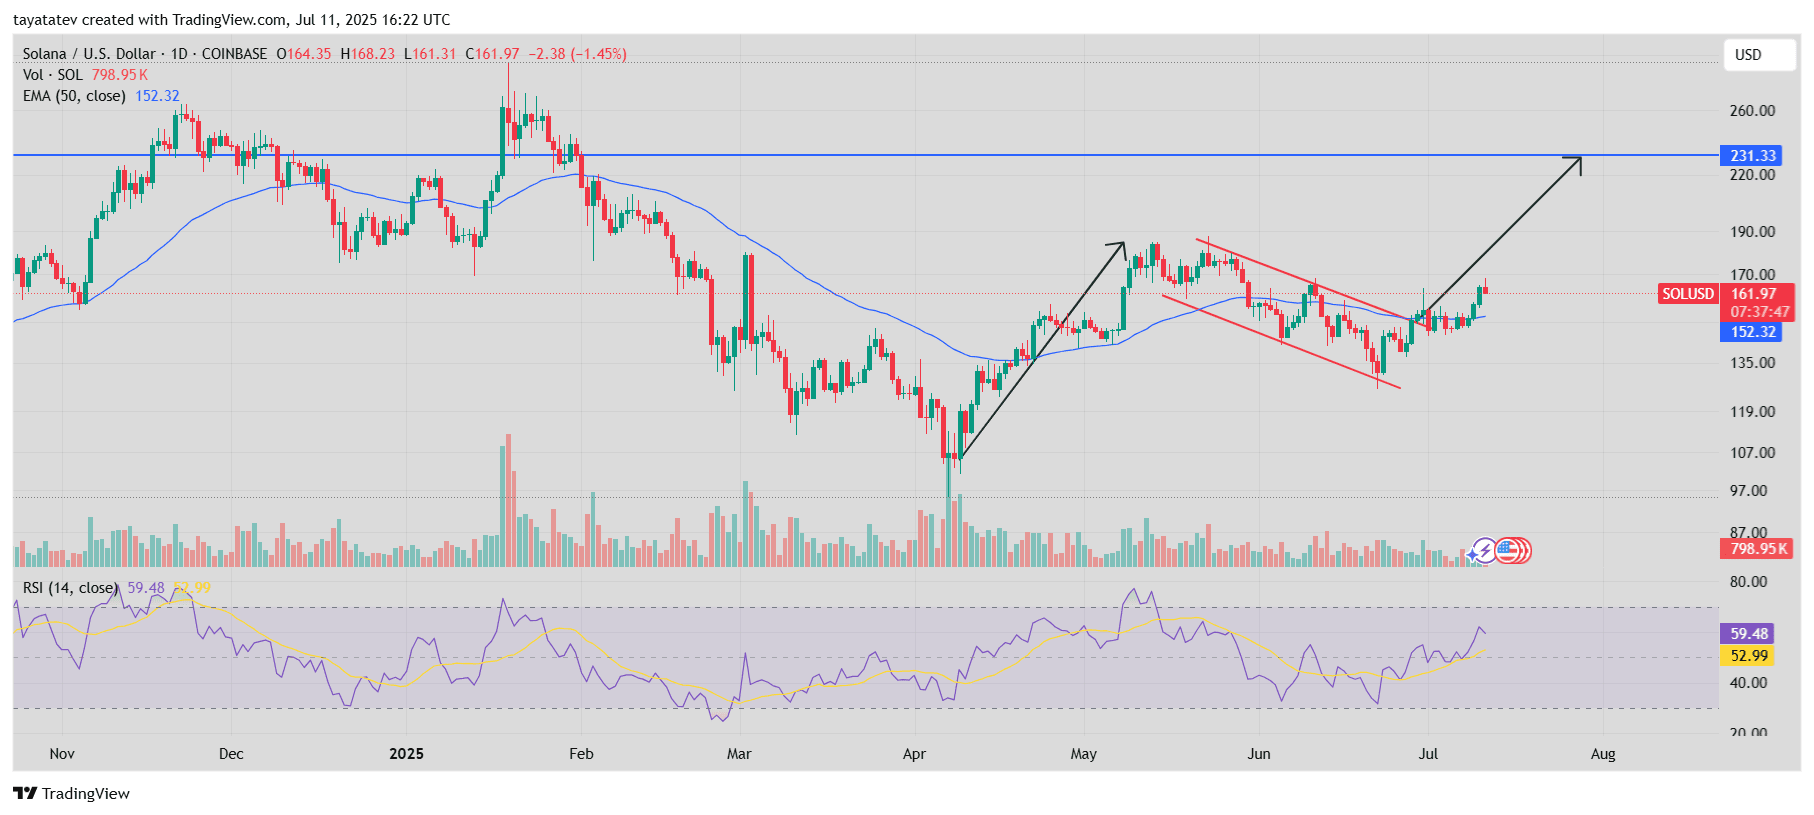
In this case, Solana moved sharply upward in late April through mid-May 2025. Then, from May to early July, it entered a downward-sloping channel with parallel trendlines, forming the flag. This type of setup indicates a pause in momentum before a possible continuation of the prior uptrend. The breakout above the flag’s upper boundary confirms the pattern.
If the breakout holds, Solana’s price could rise approximately 44% from its current level near $162. The target based on the flagpole’s height places the next key level at around $231.33. The 50-day exponential moving average (EMA) currently sits at $152.32 and has started curving upward, suggesting improving short-term trend strength.
Meanwhile, volume remained stable but slightly higher on breakout days, which aligns with typical bullish flag behavior. The Relative Strength Index (RSI), now at 59.48, has also moved above its moving average at 52.99, showing renewed buying pressure without yet reaching overbought levels.
This combination of technical signals—breakout above resistance, rising RSI, and support from the EMA—supports the structure’s validity. However, market participants often wait for continuation after the breakout to confirm the move. If Solana holds above the broken trendline, the price may trend toward the $231 area in the coming sessions.
MACD Indicator Shows Bullish Momentum Building for Solana
The Solana (SOL) Moving Average Convergence Divergence (MACD) chart from July 11, 2025, shows early signs of bullish momentum. The MACD is a technical indicator that compares short- and long-term momentum using two moving averages—typically the 12-day and 26-day exponential moving averages. It helps traders assess whether the trend is gaining or losing strength.
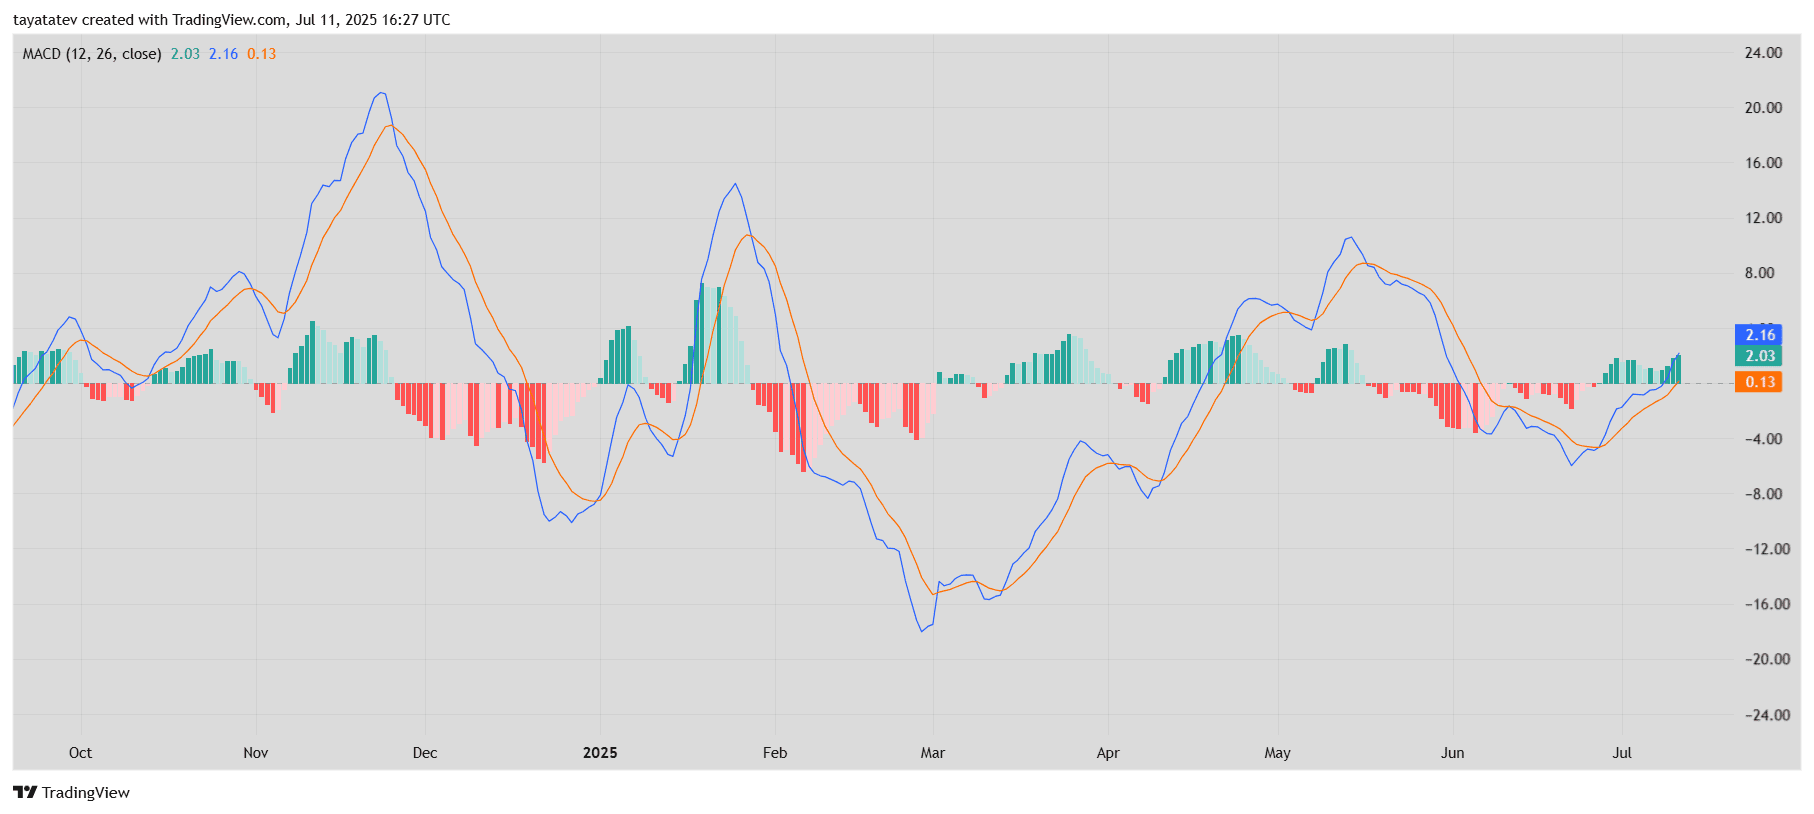
On the chart, the MACD line (blue) has crossed above the signal line (orange). This crossover happened below the zero line, and the MACD histogram bars have turned green. These shifts suggest that bullish momentum may be forming, especially as the histogram values rise into positive territory.
The MACD value is now at 2.03, while the signal line is at 0.13, creating a positive spread. The histogram bars continue to climb, showing acceleration in the price trend. When this pattern emerges alongside a confirmed price breakout—like the one seen on Solana’s daily chart—it often adds confidence to the trend direction.
This latest crossover mirrors the pattern seen in April 2025, when Solana started a major upward move. At that time, the MACD confirmed the trend after several weeks of negative movement. While the MACD does not predict how long a trend will last, the current setup indicates that positive momentum may be gaining strength again.
دیدگاهتان را بنویسید