
Bitcoin (BTC) price surged above $110,000 on July 3, briefly touching an intraday high near $110,500, marking its third attempt to breach that critical resistance level in recent weeks.
Robust U.S. labor data, fresh institutional inflows into spot Bitcoin ETFs, and positive risk sentiment tied to macroeconomic developments likely propelled the rally.

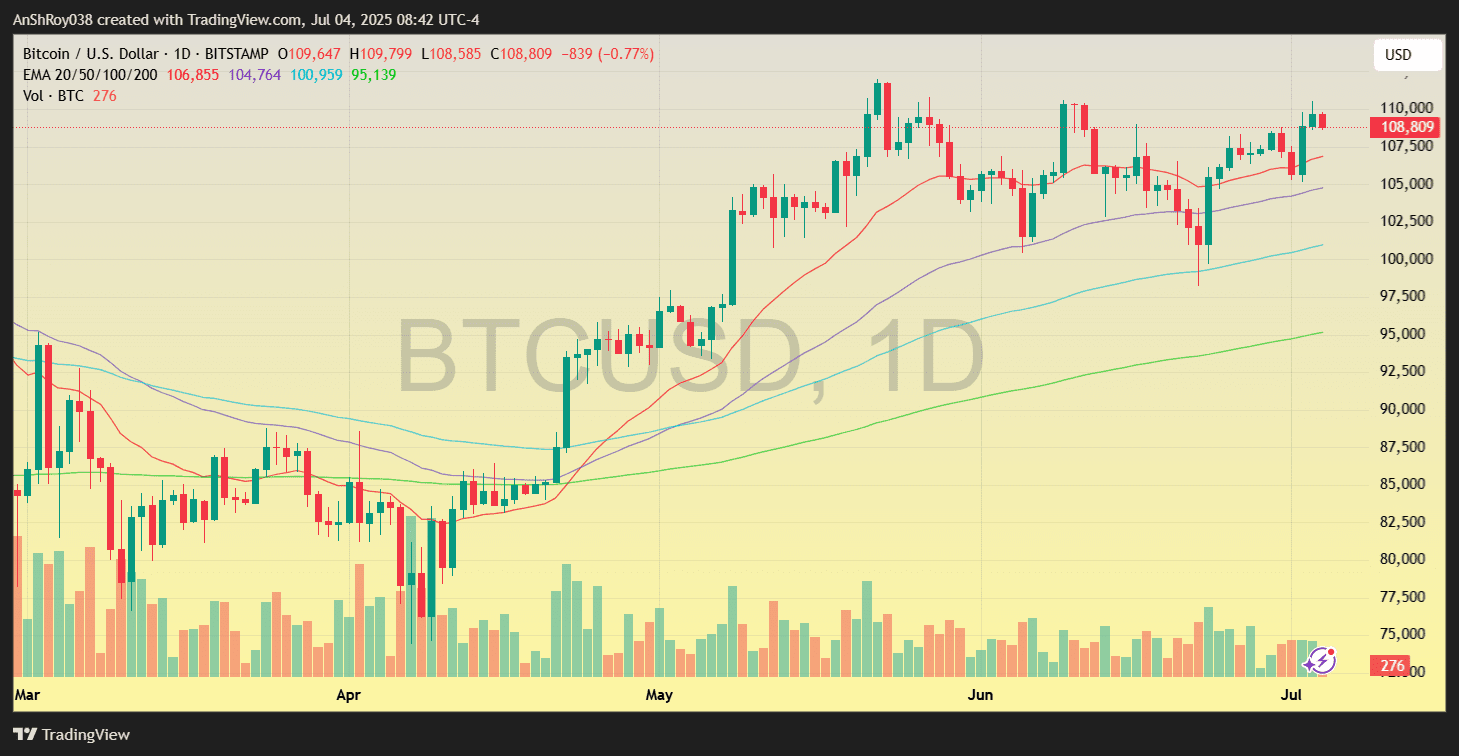
However, the rally quickly lost steam as traders encountered pronounced selling pressure on July 4. Persistent technical hurdles around $110,000 triggered a swift 1–2% pullback, stabilizing the price near the $108,800–$109,500 zone. The price action underscores the duel between strong institutional demand and mounting on‑chain signs of caution.
Dormant Bitcoin Whales Move Billions After 14 Years
Two long-dormant Bitcoin wallets, each holding 10,000 BTC, were reactivated on July 4, 2025, marking one of the most significant legacy coin movements in recent years. Both addresses received their coins on April 2, 2011, when Bitcoin traded at $0.78.

Combined, the wallets shifted 20,000 BTC—worth more than $2.18 billion at the time of transfer—without any prior test transactions.
Blockchain data confirmed that wallet 1KbrSKr…WJYm executed 80 outbound transactions, transferring its full balance of 10,000.0169 BTC. Wallet 12tLs9c…xj2me executed 64 outbound transactions for 10,000.0114 BTC. The exact recipient destinations remain unidentified, with no direct links to exchange clusters, suggesting cold storage reshuffles or internal repositioning by early holders.
The timing raises questions. Bitcoin had just rejected resistance at nearly $110,000 and was trading in the $109,000 range when the transactions occurred. These movements do not appear to have directly impacted spot order books, but their symbolic weight is substantial.
Reactivations of this scale challenge the assumption that early coins are permanently locked or lost and highlight the potential for long-term holders to re-enter circulation at pivotal price points.
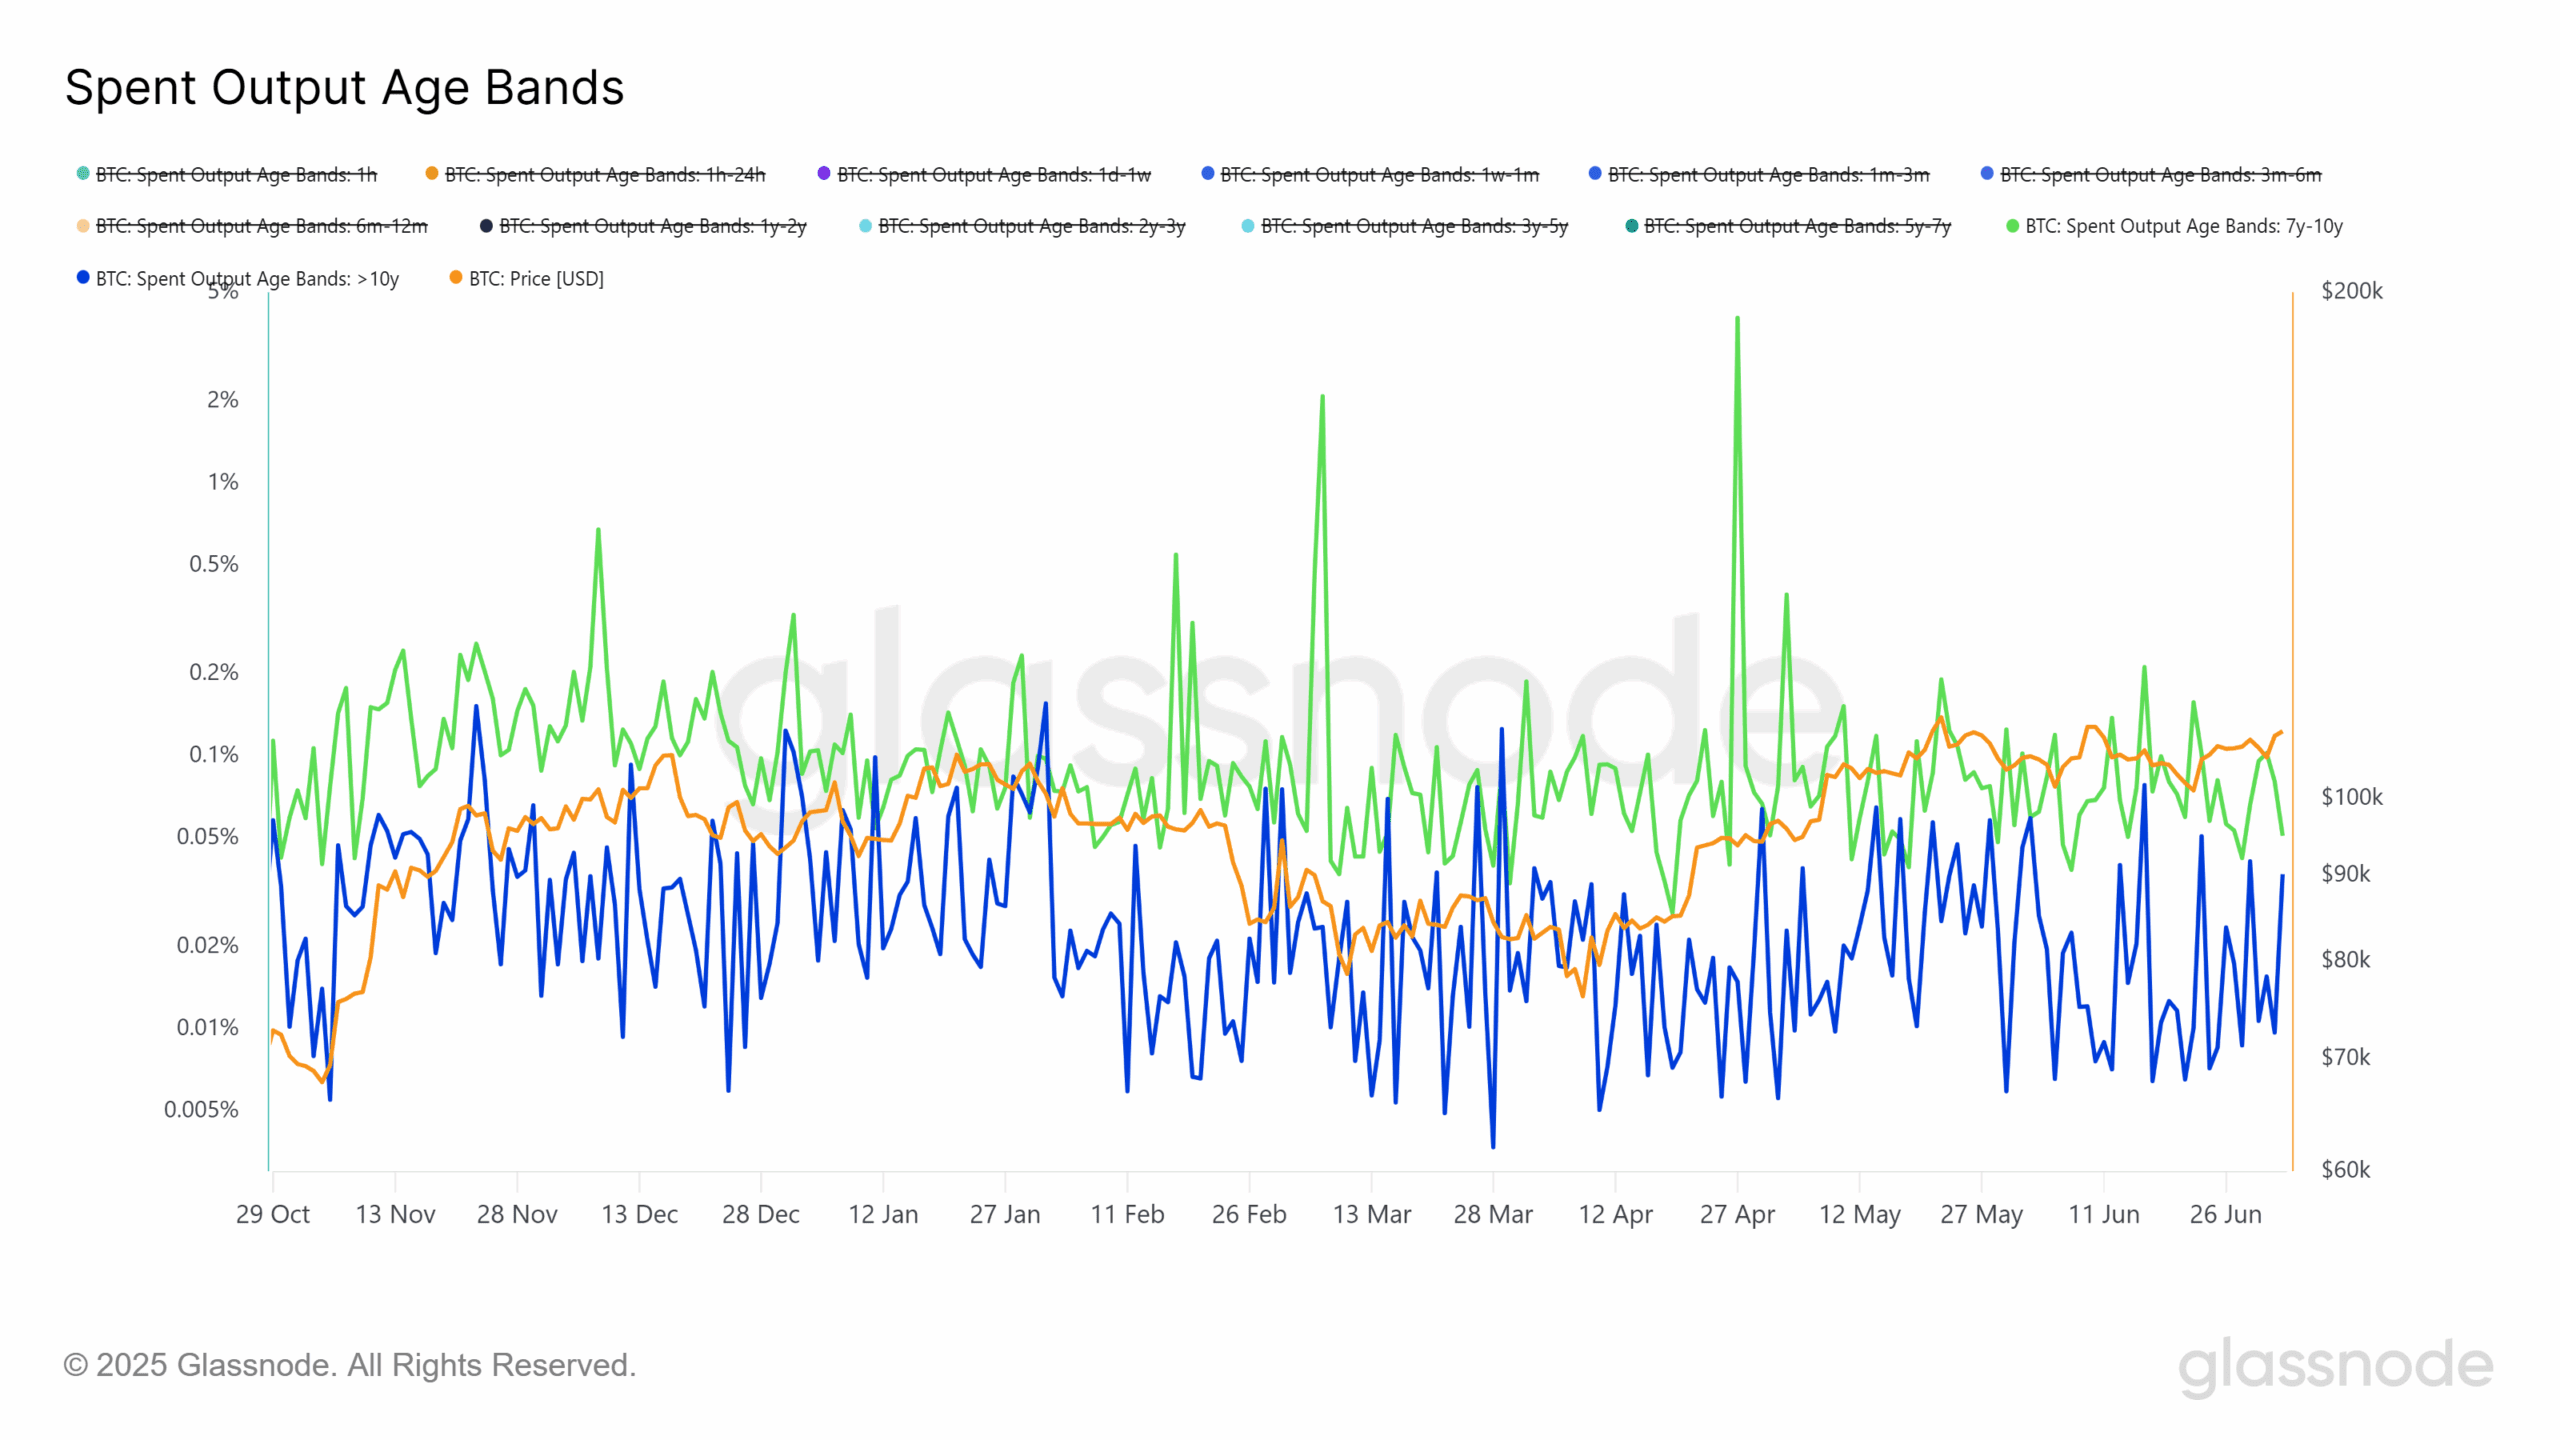
Moreover, Glassnode’s Spent Output Age Bands chart validates the scale of the event. The chart showed a pronounced spike in the 10+ year category. Historically, such spikes have coincided with market inflection points, signaling early-stage distribution or renewed capital mobility among legacy holders.
With Bitcoin’s price still struggling for directional clarity above $108,000, the return of early whales adds another layer of complexity to its short-term trajectory.
Analysts Chart Diverging BTC Targets Amid Breakout Retest
Bitcoin’s recent breakout above $110,000 has split technical analysts on the asset’s short-term path. On July 4, crypto trader Dariusz Kowalczyk noted that the BTC USD pair had bounced sharply from the $105,000 support and confirmed a daily breakout.
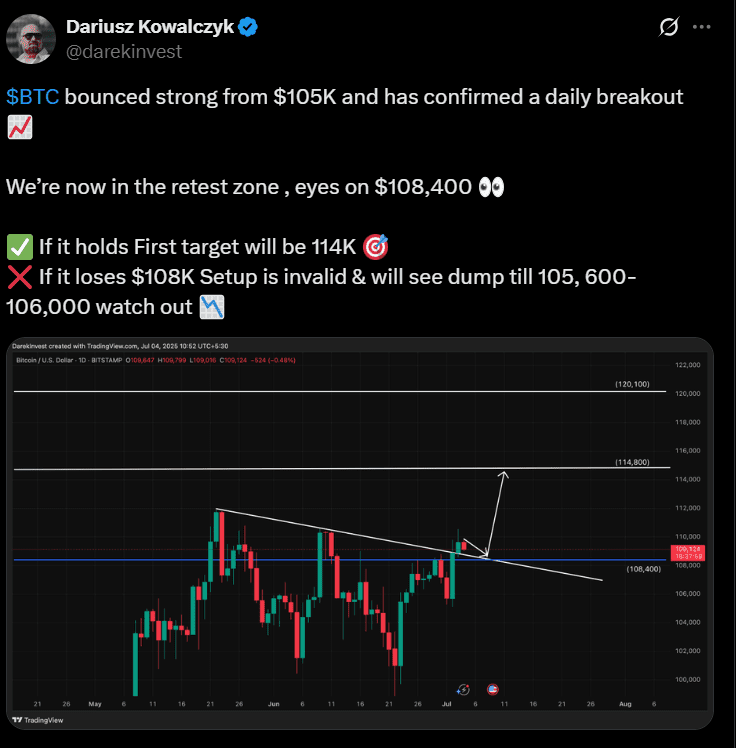
Moreover, Kowalczyk stated the price action has now entered a critical retest zone of around $108,400. If BTC holds this level, his model forecasts a move toward $114,000, with further continuation potentially eyeing $120,100. However, the analyst warned that a decisive drop below $108,000 would invalidate the breakout setup, potentially triggering a drop to the $105,000–$106,000 range.
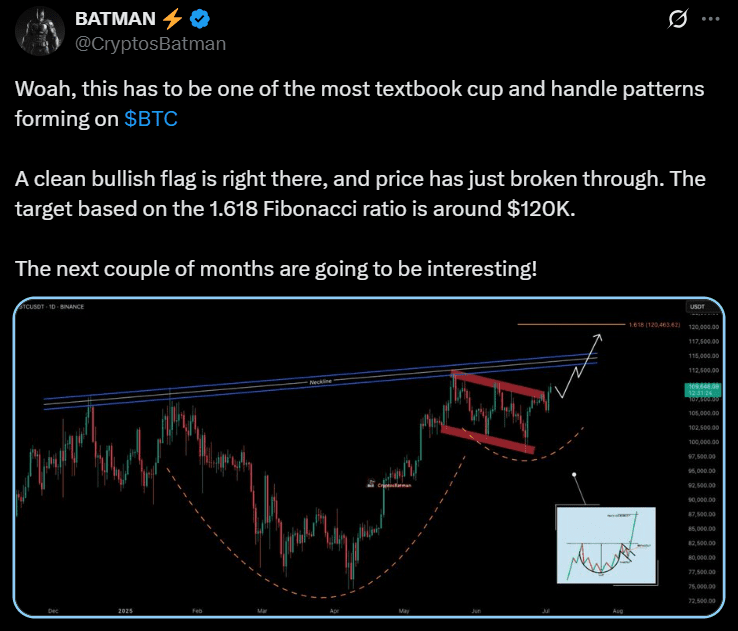
Meanwhile, an X post by pseudonymous crypto analyst Batman highlighted a bullish cup-and-handle structure forming on the daily chart. He suggests the handle recently completed its final leg, and BTC has broken out from a parallel flag consolidation pattern.
Using the 1.618 Fibonacci extension from the structure’s base, he projects a bullish upside target near $120,000. The setup, he argues, mirrors classical breakout theory, where the measured move completes after a breakout from handle resistance.
However, July’s retest range remained a key pivot zone. While the analysts’ projections differ in granularity, they agree that BTC must hold above $108,000 to maintain upward momentum.
The structure appears technically valid, but follow-through remains limited. Spot volumes are thin, and market-wide leverage remains elevated, leaving BTC vulnerable to sharp intraday reversals if bullish conviction doesn’t return quickly