Bot-driven activity on Ethereum contributed to the surge in stablecoin volume and pushed stablecoin swaps on DEXs to a new all-time high.
Record-low gas fees in 2025 made Ethereum mainnet more attractive for stablecoin activity than competing chains.
Stablecoin transfers and market cap shifted back from L2s to Ethereum L1, reversing last year’s trend and boosting mainnet dominance.
In May 2025, bot activity on Ethereum registered its largest share ever in stablecoin transfers, representing 57% of volume and 31% of transaction count. Bots on Ethereum made over 4.84 million stablecoin transfers, totaling more than $480 billion last month, also reaching all-time high levels.
Increased bot activity helped lift Ethereum L1 back to the center of DeFi activity, boosted existing operations, and caused significant changes in Ethereum’s DEX volume distribution. Here is why this happened — and what this trend could mean for Ethereum going forward.
Low-Fee Environment Fueled the Bot Surge
The most impactful factor that boosted bot activity on Ethereum has been an over 92% drop in mainnet fees in early 2025. With gas prices hovering below 1 gwei in March and April, Ethereum L1 became more cost-competitive in stablecoin transfers not only compared to other L1 networks but even to its L2s. Most of Ethereum’s gains in overall stablecoin activity this year occurred during this record-low-fee period.
However, stablecoin transfers are the most fee-sensitive type of transactions. For example, following the Pectra upgrade in early May, Ethereum L1 saw elevated fees, which led to a 8% decrease in total stablecoin transaction volume and a $1 billion drop in stablecoin market cap. This slowed the growth of bot activity within the network but didn’t reverse it, as the sector was still riding the momentum from the low-fee period.
Chart: Transaction Fee Comparison Between Ethereum and Its L2s
Bots were primarily used for automating swaps, arbitrage strategies, and liquidity routing, which contributed to the spike instablecoin swap dominance on Ethereum’s DEXs. In April and May, stablecoin swaps held the top spot in Ethereum’s DEX activity for two consecutive months for the first time ever, making up 37% and 32% of total DEX volume, respectively.
As a result, USDT and USDC took center stage, increasing its share in DEX volume (green circle). In March and April, USDC even became the most traded asseton Ethereum DEXs.
Ethereum’s transition to a more stablecoin-focused DEX volume signals a broader transition in Ethereum’s on-chain economy — one that favors utility and payment-focused use cases over speculative trading. In 2025, only two categories saw meaningful DEX volume increases on Ethereum: tokenized assets, which surged by 284%, and stablecoin swaps, up 31%.
Ethereum Eats Up L2s in the Stablecoin Field
One of the major consequences of Ethereum’s bot expansion and reduced fees was that L1 has been increasingly taking the market share from its L2s.
Stablecoin market cap
So far in 2025, Ethereum mainnet’s stablecoin market cap grew by 11%, while the combined stablecoin market cap on L2s shrunk by 1%. For comparison, in 2024, Ethereum mainnet posted a 65% increase, but L2s collectively surged by 218%. The biggest declines in stablecoin supply among L2s this year have come from Optimism, which lost over $700 million.
Transaction Volume
In total, the Ethereum ecosystem, including mainnet and L2s, processed over $11 trillion in stablecoin transaction volume in 2025 to date, triple the volume seen over the same period in 2024. This brought Ethereum’s share of global stablecoin volume to 60%, up from 40% in 2024, indicating that stablecoin activity has been shifting to Ethereum from other L1 networks as well.
At the time of this writing, L1 and L2s were showing a nearly 50/50 split in monthly transaction volume within the Ethereum ecosystem, with mainnet largely reclaiming positions starting March 2025, or during record-low-fee environment.
Transaction Count
In 2022-2024, L1’s share of stablecoin transactions in the Ethereum ecosystem was primarily declining to as low as 22%, since users increasingly favored L2s for their lower costs. But, in 2025, that trend has also flipped. According to GrowThePie data, Ethereum mainnet recorded over 30 million stablecoin transactions this year, lifting its share in transaction count to 42%.
Chart: Transaction Count Distribution Across Ethereum and Its L2s
Final Thoughts
While bots are often associated with sandwich attacks and frontrunning, Ethereum’s increase of bot activity within the stablecoin field shows that they could be among the major drivers to improve market efficiency, boost stablecoin adoption, and enhance DEX performance — a net positive for users and protocols alike.
Still, stablecoin transfers are highly fee-sensitive, meaning that the network may face a trend reverse and user migration outside Ethereum if fees remain elevated. However, if L1 manages to maintain a low-fee environment over time, this could help Ethereum reclaim further market share in the stablecoin space.
On-chain RWA value surged by $7.5 billion in 2025, matching 2024 growth, and outperforming other sectors within the DeFi ecosystem.
Tokenized treasuries led inflows, with Euro bonds doubling its on-chain value and BlackRocks’s BUIDL capturing 79% of U.S.-treasury-based RWA growth in 2025.
Tokenized gold beat its 2024 figuresin both market cap and new holders increases.
Ethereum ecosystem’s dominance strengthened, hosting over 83% of RWA value on general-purpose chains.
Real-world assets are no longer a side bet in DeFi — they’re becoming the main event. After adding $7.5 billion in on-chain valuethroughout 2024, the RWA sector matched that figure in the first five months of 2025. On May 13, on-chain RWA value reached $23.8 billion, up from $16.3 billion at the start of the year.
The surge isn’t just about capital. The number of RWA holders has also crossed a key milestone, surpassing 100,000 addresses, showing a 22% increase in 2025 so far.
This rapid expansion in both adoption and value comes as most DeFi sectors are seeing stagnation or contraction. With the RWA sector surging by 43% in 2025, its on-chain value briefly surpassed total DEX TVL.
The Drivers Behind the RWA Surge and Biggest Winners
While RWAs as a whole are surging, not all sectors are riding the same wave. In 2025, market uncertainty — not just yield — has become the dominant catalyst, and no asset classes reflect that more than bonds and gold.
Tokenized Euro Bonds Doubled in New On-Chain Value
The sharpest RWA sector spike came from Non-U.S. bonds, which saw a 101% increase in on-chain value in 2025 so far. This sector saw distinct inflection points that coincided with political headlines — most notably, accelerated inflows following Trump’s inauguration and another local jump after a selection of tariffs became effective on March 3-4.
Among Non-U.S. bonds, Euro-denominated ones stand out as the biggest winner, adding $102.6 million in on-chain value in 2025, and already outpacing 2024 on that matter. Most of these inflows went to Spiko’s EUTBL, which now accounts for over 80% of this RWA segment, experiencing 114% and 78% increases in value and holders in 2025, respectively.
However, tokenized Euro bonds account only for 1% of the entire RWA sector, meaning this hasn’t been the biggest landscape mover, despite the local surge.
BUIDL Took Over the U.S. Treasuries Segment
Tokenized U.S. treasuries had a much larger impact on the RWA sector, adding over $2.8 billion in on-chain value throughout this year. Around 79% of these inflows were allocated to BlackRock’s BUIDL, which has been securing the top spot in this segment starting mid-March. March 12, when the EU announced retaliatory tariffs, has also been the turning point in rapid BUIDL expansion, as nearly all of its gains occurred after this date. As such, BUIDL showed a more than 343% increase in new value added year-to-date, outpacing even much smaller funds.
Notably, BUIDL has also been among the leaders in attracting new holders, showing a 57% increase in the first five months of the year. This appears to be remarkable as BUIDL is not available on open markets, and features a much larger entry threshold. According to Amberdata, BUIDL features a minimum investment worth $5 million, while USTB, OUSG, USYC, and TBILL — $100,000. This signifies that the expansion of tokenized U.S. treasuries was primarily driven by institutional investors.
Another catalyst that pushed BUIDL forward was the downfall of USYC, which saw an over 3,000% increase in on-chain value in 2024, and dominated the space between November 2024 and March 2025. USYC experienced an over 73% drop in on-chain value in 2025, which began shortly before Circle’s acquisition of Hashnote, USYC issuer. The USYC drop occurred due to the yield-bearing USD0 stablecoin, which utilizes USYC as a primarily backing asset, and lost 60% of its TVL this year.
Tokenized Gold Overshadowed Its 2024 Performance
In parallel with the surge in fixed-income RWAs, tokenized commodities, especially gold, have emerged as a resilient safe-haven sector, benefitting from the same macro tailwinds. Total market cap for tokenized commodities grew by over $547 million in 2025 to date, with gold-backed tokens accounting for nearly 98% of that growth.
This momentum has been largely led by Paxos’ PAXG, Tether’s XAUT, and Kinesis’ KAU, which together make up 88% of gold-related trading activity. Among them, XAUT saw the most significant growth in user base, nearly doubling its number of holders (+102%) since January. Despite this, PAXG still dominates the space in terms of holders, outpacing XAUT by nearly 10 times.
As such, tokenized gold has already managed to beat its 2024 figures in both increased on-chain value and new holders.
While tariff-induced uncertainty served as a major catalyst to boost tokenized gold, activity stayed elevated even after the tariff noise began to subside. On April 22,tokenized gold trading volumes spiked to nearly $400 million, coinciding with gold spot prices hitting an all-time high above $3,500. This is the highest daily trading volume that tokenized gold showed since the U.S. banking crisis in March 2023.
Ethereum Ecosystem Strengthened Its RWA Dominance
In 2025, Ethereum’s role as the central infrastructure layer for RWA has become even more pronounced. The combined Ethereum ecosystem — including both mainnet and L2s — now accounts for over 82% of total RWA value hosted on general-purpose blockchains, up from 75% at the start of the year and 70% in early 2024.
This growing dominance is driven by two complementary trends: the rise of products originally launched on Ethereum such as BUIDL, and the rapid emergence of new RWA platforms on Ethereum L2s. The most notable example was the debut of Tradable, a private credit-focused platform that deployed over $1.7 billion in assets on zkSync. This single launch catapulted zkSync into the position of second-largest general-purpose blockchain in RWA.
Furthermore, unlike most other chains that depend on a single RWA vertical or flagship project, Ethereum offers the most diversified spectrum of RWA products. This gives Ethereum an inherent advantage: it’s not overly reliant on the success of any one sector. Instead, it acts as the primary execution layer for RWA growth wherever it happens.
While Ethereum dominates the general-purpose blockchain landscape, it’s important to note that in a broader view — including purpose-built blockchains — Provenance technically takes the top spot. This is largely due to its private credit platform Figure, with nearly $10 billion in RWA TVL.
Final Thoughts
RWAs are not only leading the DeFi recovery — they’re setting the pace of it. With over $7 billion in new on-chain value added in under five months, the sector is evolving to become a core infrastructure in both institutional and decentralized finance.
That said, the sector’s further short-term trajectory will largely hinge on the outcome of the existing tariff uncertainty. If trade tensions escalate, the flight to safe-haven and yield-generating RWAs could intensify even further. But a resolution, or even a de-escalation, could test the sustainability of the current inflows. Either way, RWAs have already proven their staying power as a response to market chaos.
Sources
The data used for this research consists of publicly available information from RWA.xyz, CoinGecko, DeFiLlama, and Amberdata. The observation period for this study was focused on RWA’s 2024-2025 performance, with data points starting January 1, 2024, and ending May 14, 2025.
Bitcoin’s price correction has the potential to continue, as the daily MACD formed a signal that has consistently indicated short-term bearish dominance.
Rising leverage and funding rates reflect growing speculative interest but increase the risk of liquidation cascades if major support levels give way.
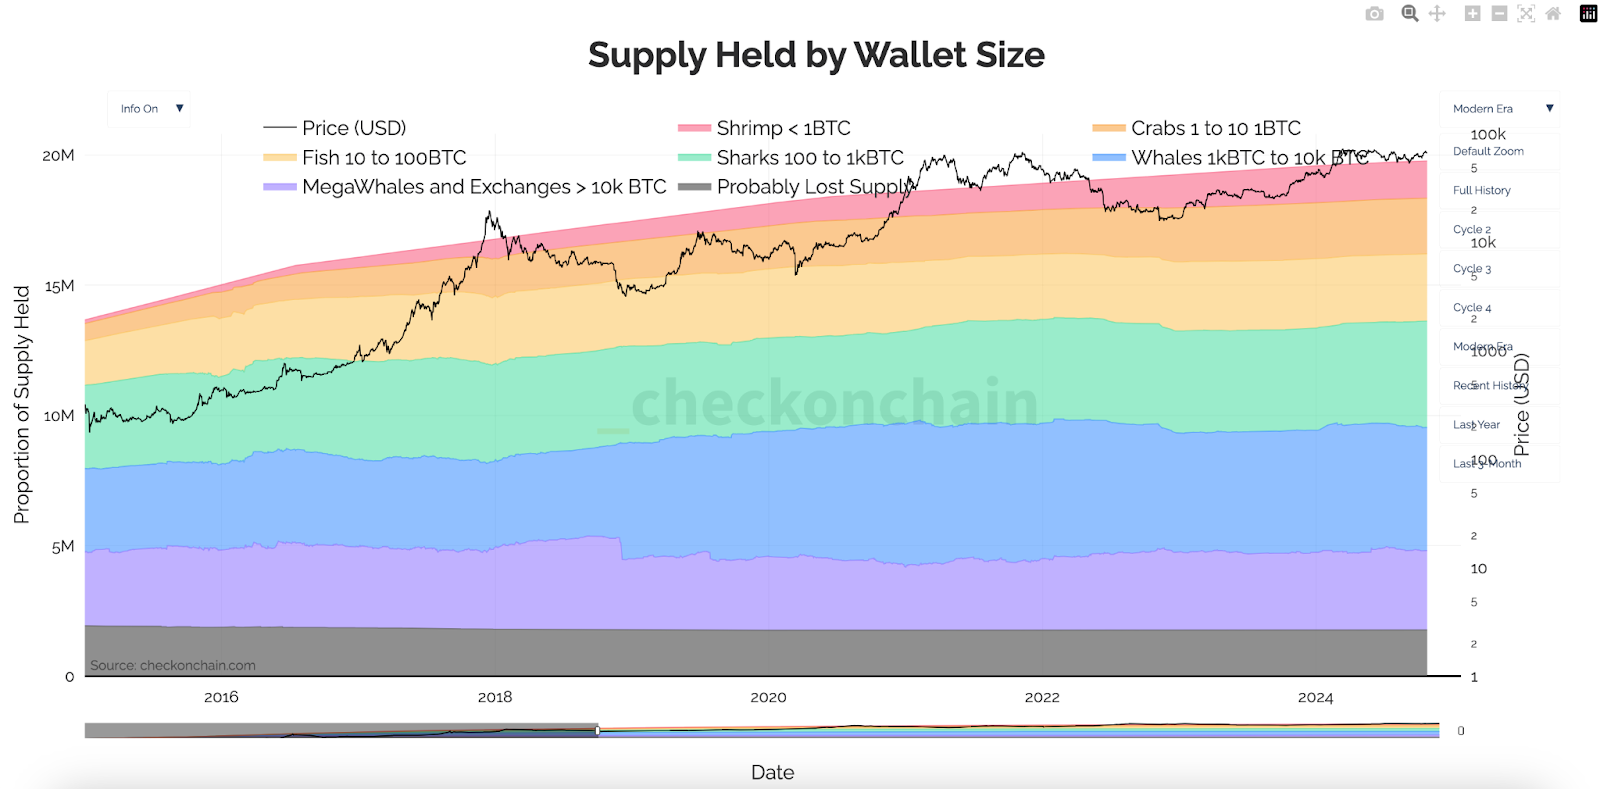
Wallets holding 100-1,000 BTC led Bitcoin accumulation over the last three months, indicating a potential bullish trend over the next 6-12 months.
Weekly outlook
Could a V turn into a W?
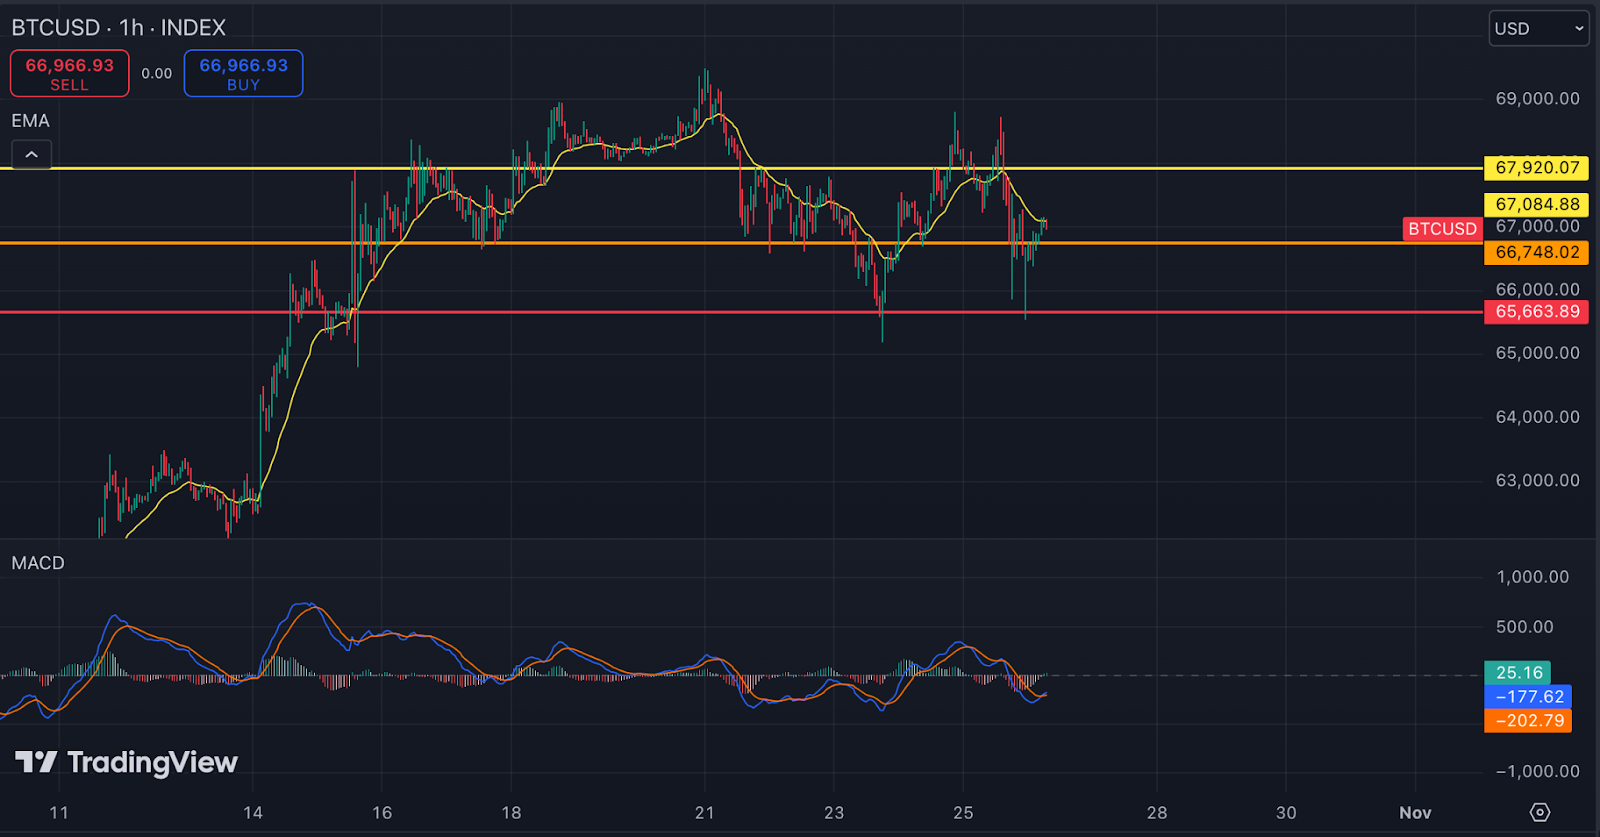
Over the past week, Bitcoin has displayed a V-shaped price movement, consolidating within a narrow range between $66,700 and $67,700 before briefly testing both $65,300 and $69,000. In our previous analysis, we highlighted that Bitcoin could see imminent correction and/or consolidation throughout last week, as bullish momentum appeared to weaken.
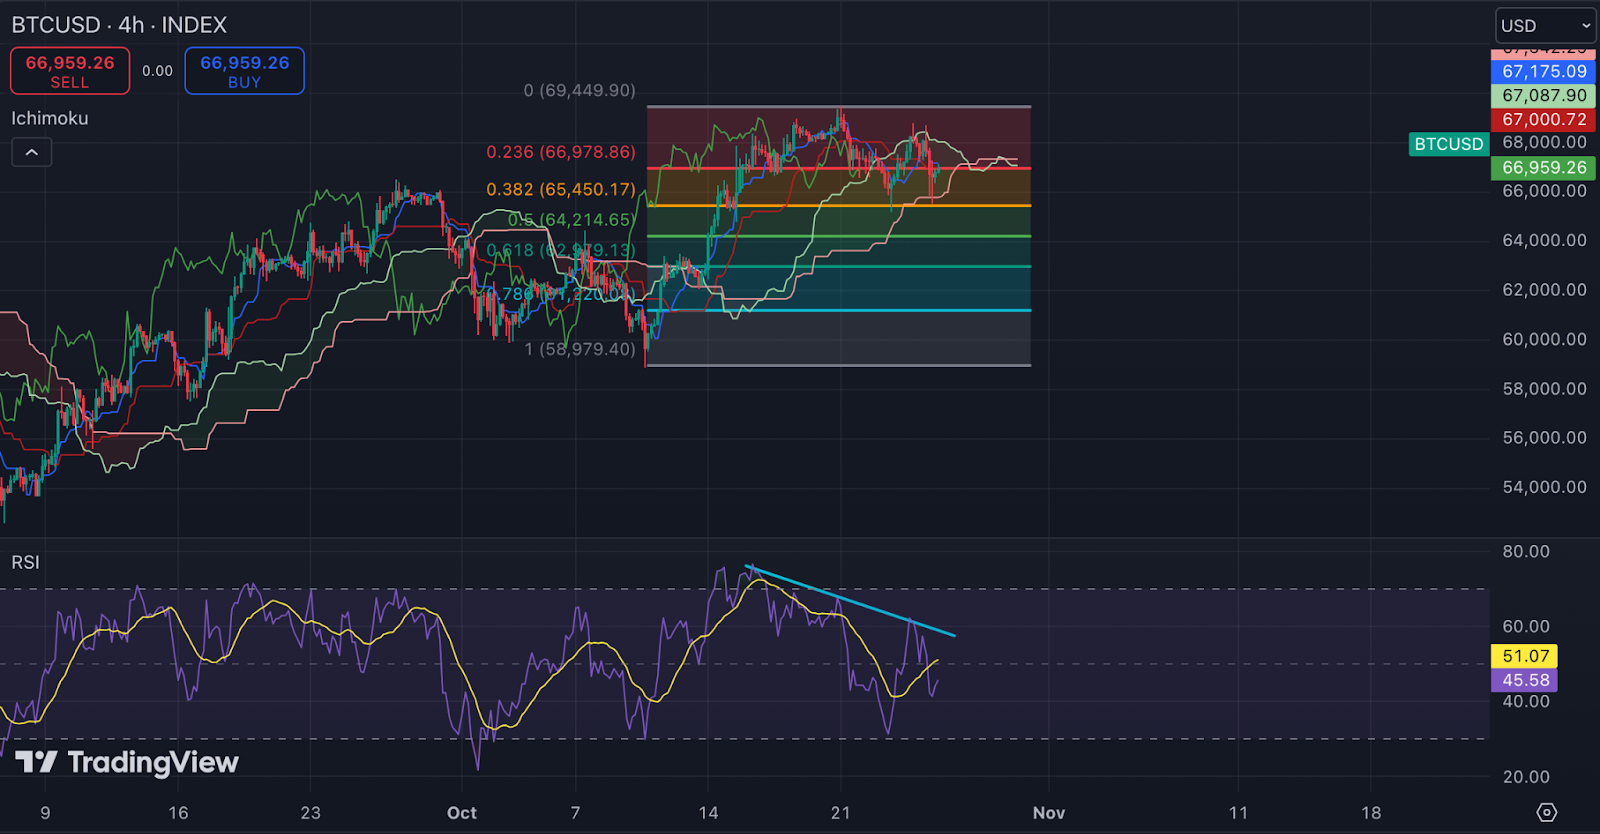
On the 4-hour chart, the RSI indicator remains in a downtrend (cyan line), suggesting the corrective phase may not be over. At the time of this writing, Bitcoin’s price is trading within the Ichimoku Cloud, with its upper and lower boundaries acting as resistance and support, respectively — indicating market indecision. A breakout outside this cloud could determine whether Bitcoin tests $69,500 or retreats to lower levels.
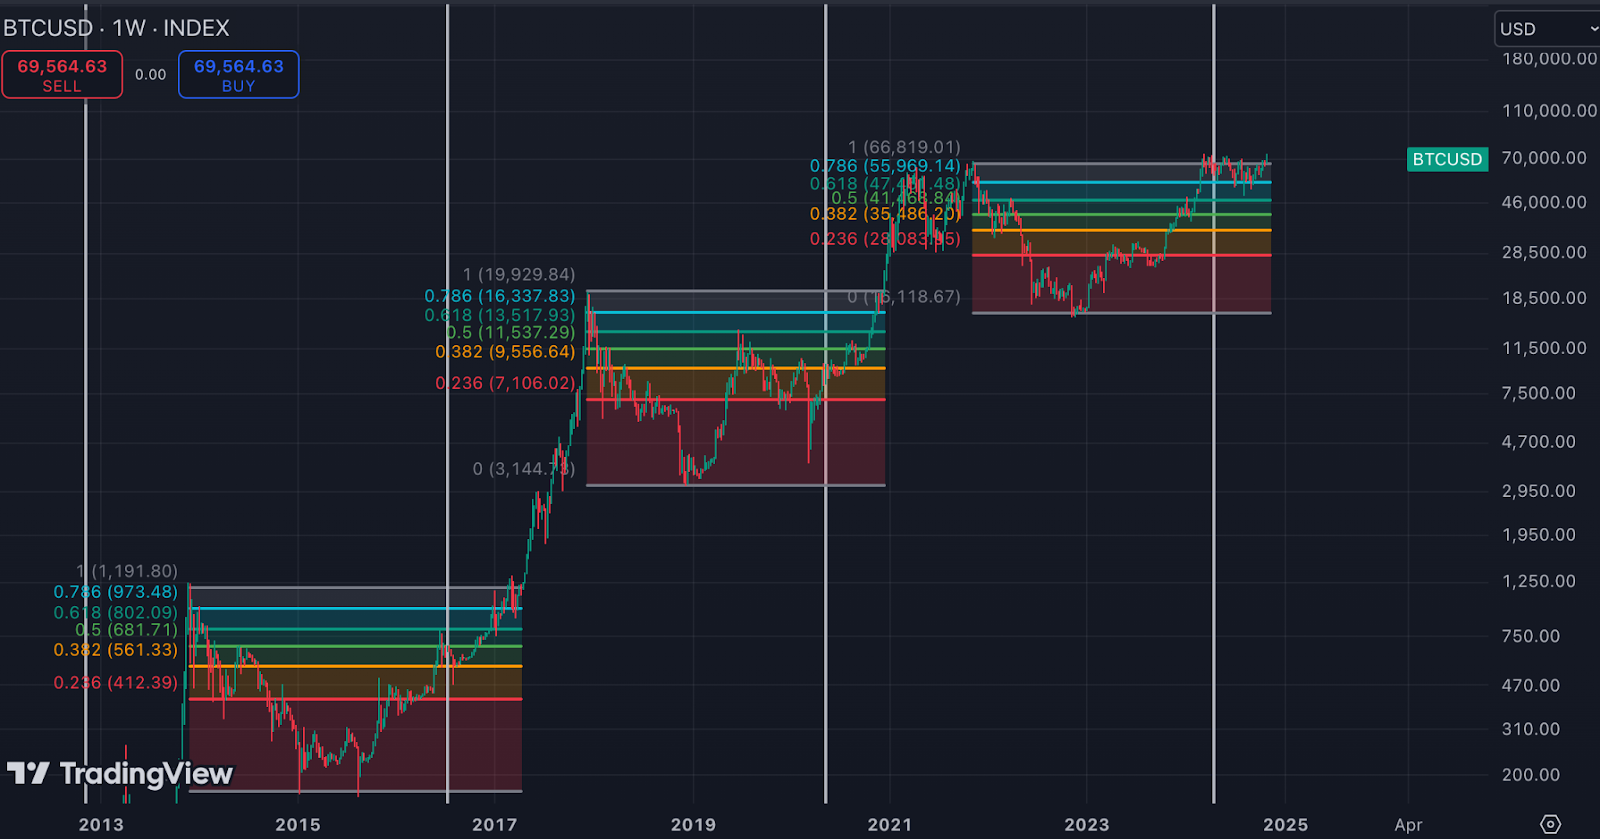
While a short-term recovery is possible, it may struggle to gain traction unless the RSI breaks through its resistance. VPVR analysis shows high volume clusters around the 0.236, 0.382, and 0.618 Fibonacci retracement levels, suggesting these as key support/resistance zones.
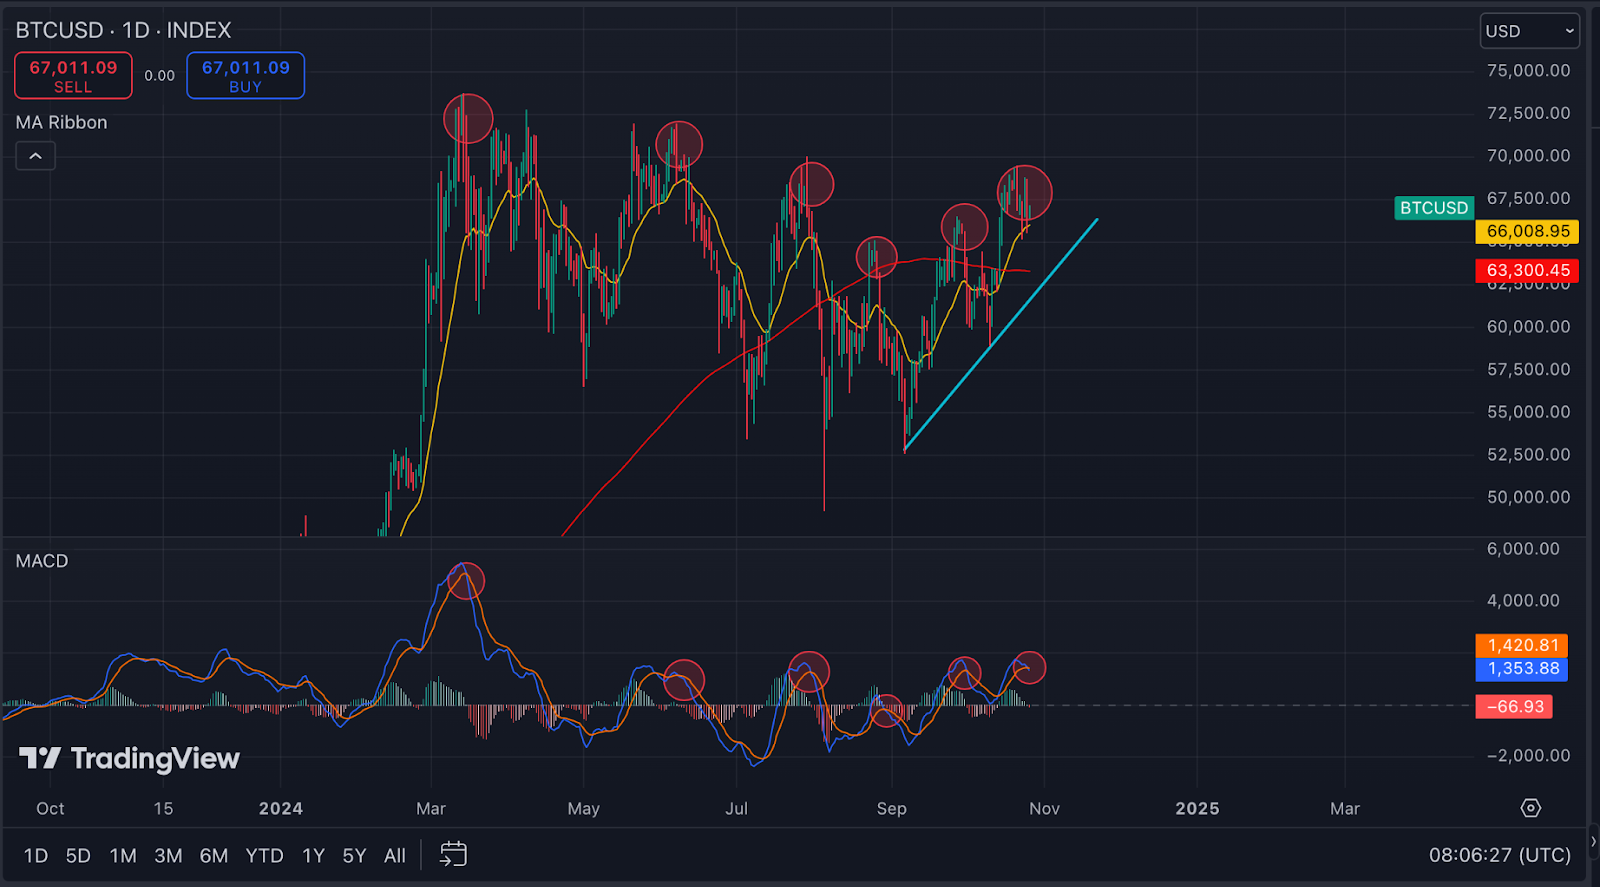
The daily chart indicates a possible continuation of the correction, as the asset formed a bearish divergence with Awesome Oscillator (AO), and a bearish crossover with MACD. Over the last 8 months, the latter typically coincided with local tops (red circles), hinting at short-term bearish dominance. This could push the price below the 20-day EMA, with the 200-day SMA as a potential target. However, the 20-day EMA, near $66,000, remains a key support for bulls; defending this level could weaken the bearish case.
Futures market speculations are getting riskier
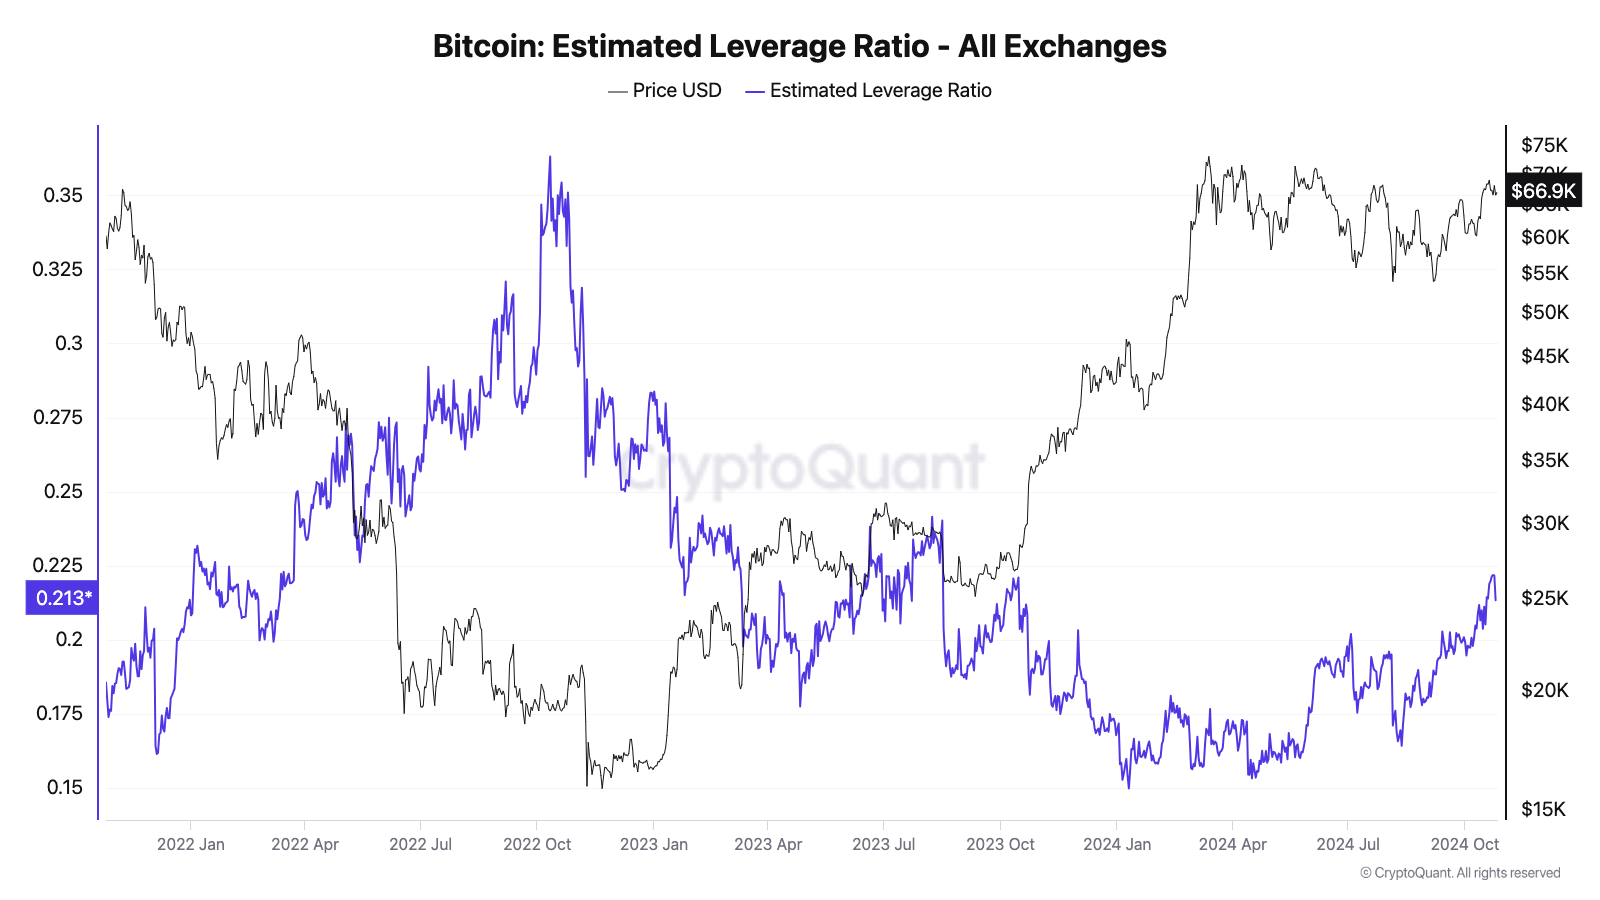
Last week, we noted that spikes in Bitcoin open interest often precede short-term corrections. Following the recent jump, Bitcoin’s futures open interest dropped by 7%, while futures volume remained relatively flat. Meanwhile, funding rates have risen on average, and the estimated leverage ratio has jumped to its highest level since August 2023. This increase in leverage suggests heightened speculative optimism but raises the risk of sharp liquidation cascades.
These conditions suggest that Bitcoin could see increased volatility in the short term. A breakdown below the 20-day EMA or other major support levels could trigger increased liquidations, potentially exerting additional downward pressure and potentially intensifying a corrective phase.
Bitcoin whale activity is intensifying, with whale numbers reaching their highest since January 2021, while whale accumulation levels are at a peak not seen since July 2020. Examining holder cohorts reveals that “sharks” (wallets holding 100-1,000 BTC) have led the recent accumulation, collectively adding over 200,000 BTC in the past three months. Historically, such accumulation by sharks has preceded prolonged bullish rallies, as similar patterns were seen roughly six months after the halvings in both 2016 and 2020, before further upward price movement.
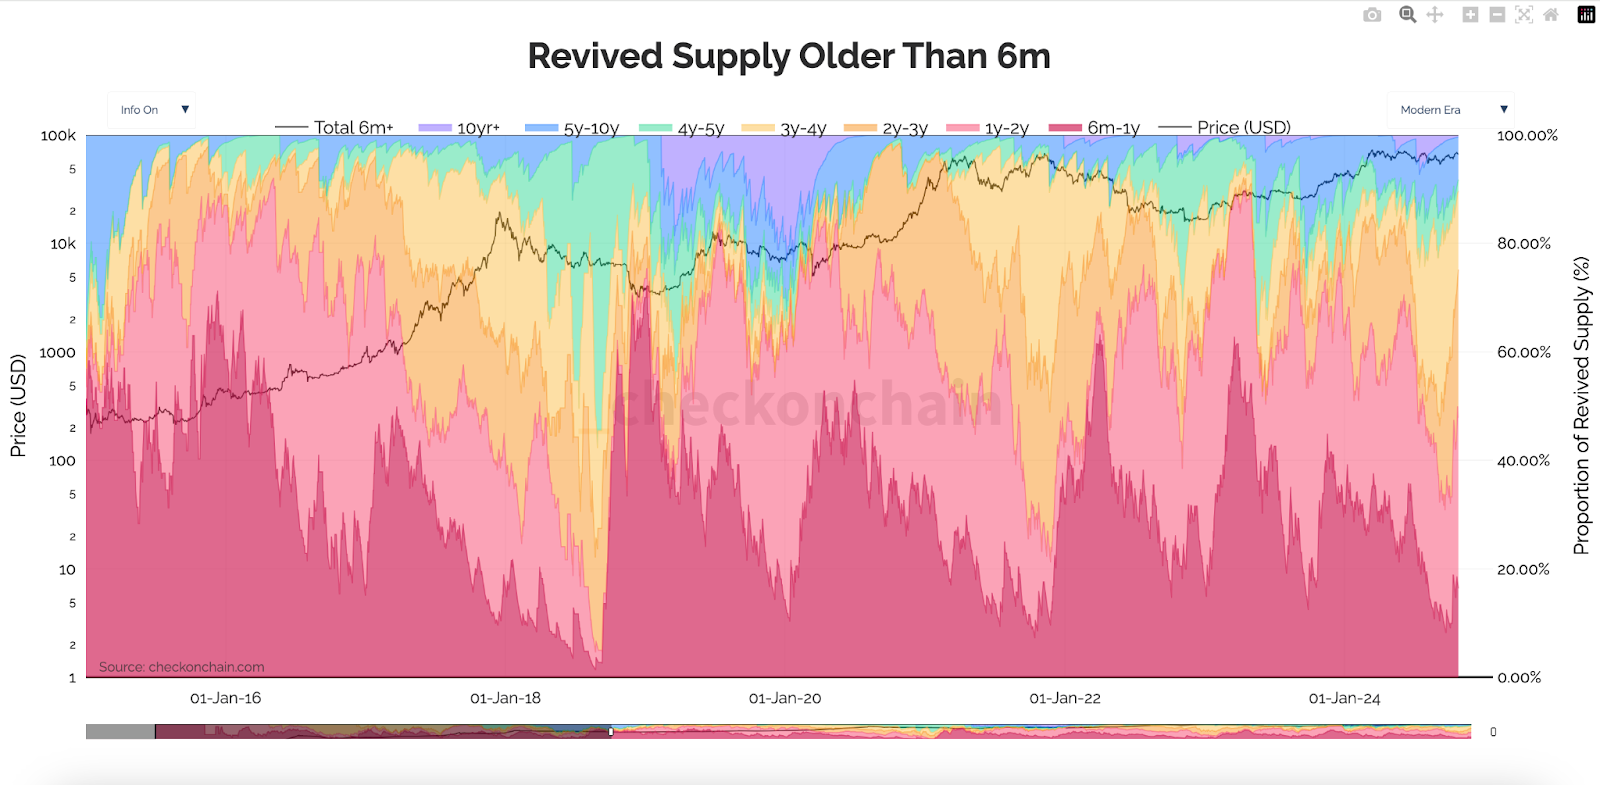
Bitcoin wallets with a 2-4 year holding period are increasingly active, now representing about 42% of the recently revived supply, up from 29% three months ago. In past cycles, rising activity among these holders has often foreshadowed a rally, as they tend to become increasingly active 6-12 months before the cycle peak.
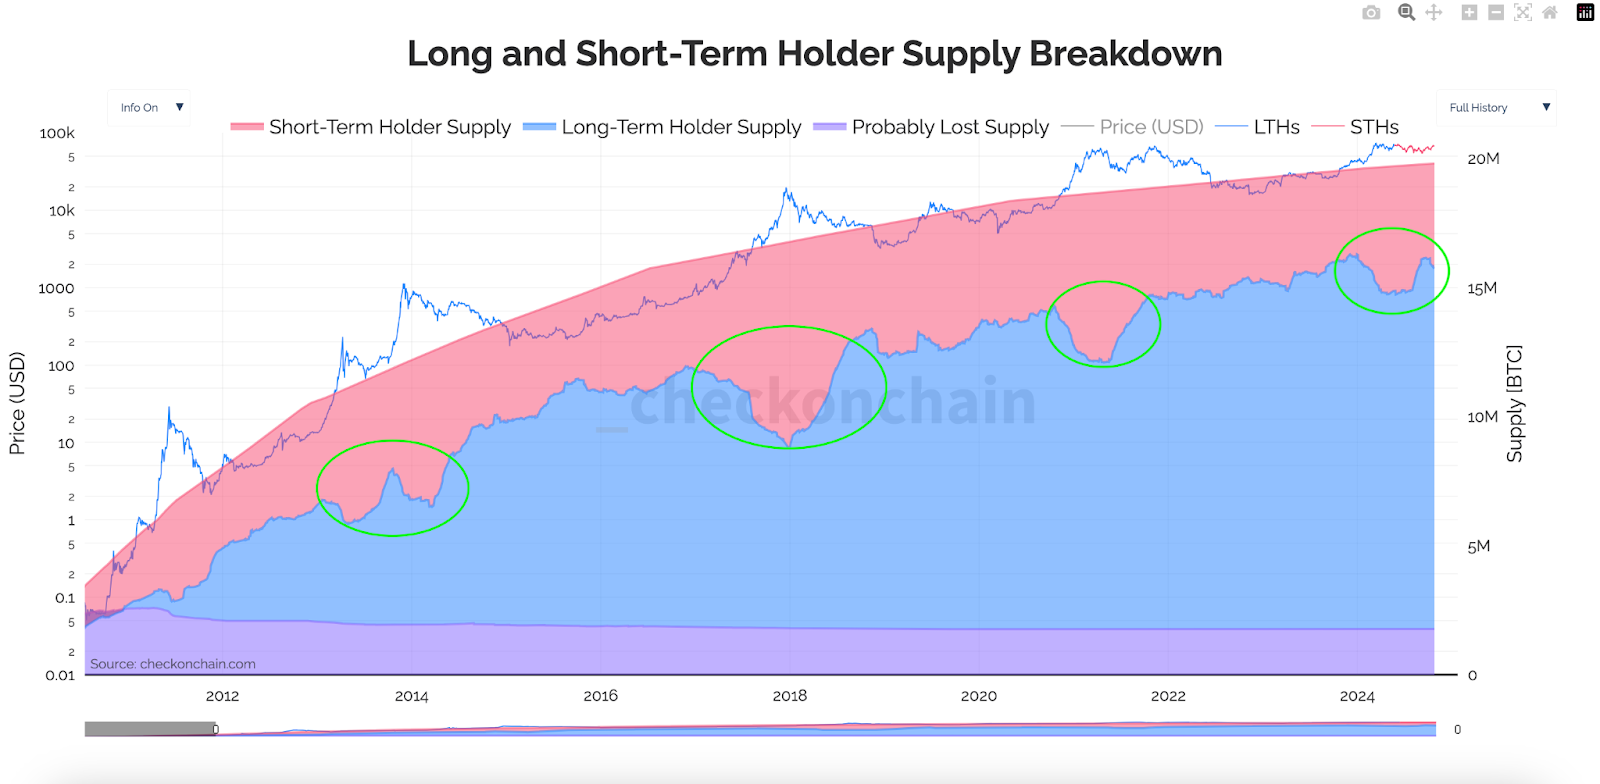
Long-term holders (LTH) have added around 1,000,000 BTC over the past three months, either through accumulation or by transitioning to LTH status, and now control over 70% of Bitcoin’s supply. However, over the last two weeks, short-term holders (STH) have been increasing their share of the supply, potentially signaling an upward move. Historically, STH accumulation increases during bull markets (green circles). The current supply distribution between STH and LTH mirrors the 2013 rally, where rapid price gains were followed by a 10-month consolidation before another rally.
Bitcoin’s price held largely to our neutral outlook from last week, remaining within a narrow range. This week could bring heightened volatility, with bears potentially challenging the 200-day SMA. While a rebound is possible, it may be short-lived unless Bitcoin breaks decisively above $70,000, which would likely require a fresh catalyst. Despite near-term uncertainty, the long-term outlook remains bullish, indicating a potential new all-time high could be approaching.
The web content provided by CEX.IO is for educational purposes only. The information and tools provided neither are, nor should be construed as, an offer, or a solicitation of an offer, or a recommendation, to buy, sell or hold any digital asset or to open a particular account or engage in any specific investment strategy. Digital asset markets are highly volatile and can lead to loss of funds. The availability of the products, features, and services on the CEX.IO platform is subject to jurisdictional limitations. To understand what products and services are available in your region, please see our list of supported countries and territories. This page includes additional links to information about individual products, and their accessibility.
Bitcoin failed to break its all-time high last week amid increased profit-taking from short-term holders, but could be poised to challenge this level soon.
Bitcoin showed double-digit weekly gains immediately after the ATH breakout in previous cycles, suggesting that this event could be accompanied by increased volatility.
Bitcoin now appears to be more in line with previous cycles, approaching the level where a significant upward trend unfolded.
Weekly outlook
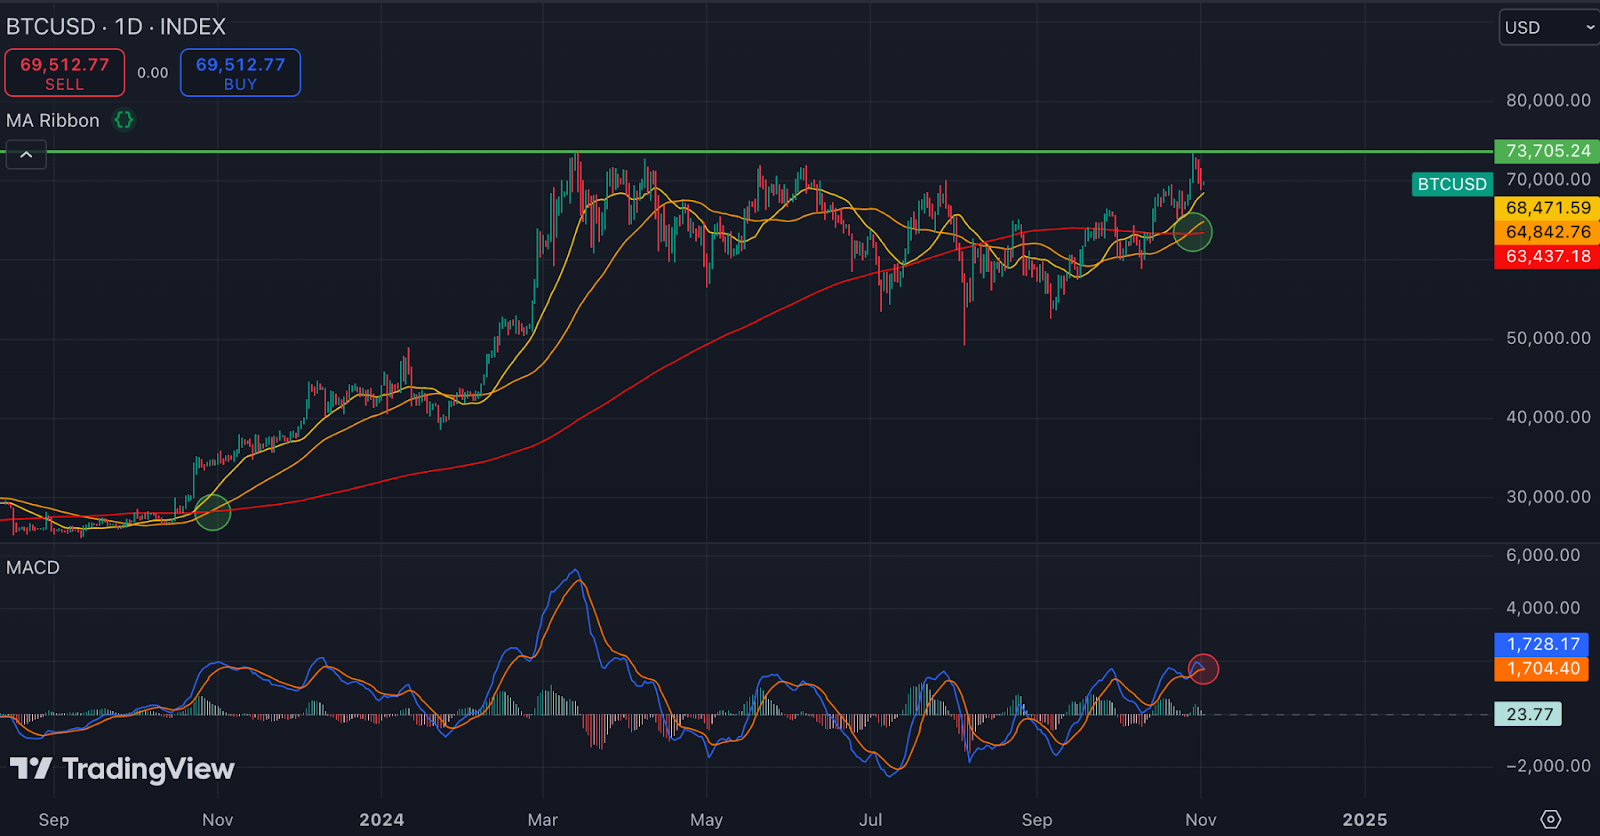
Consolidation before a breakout?
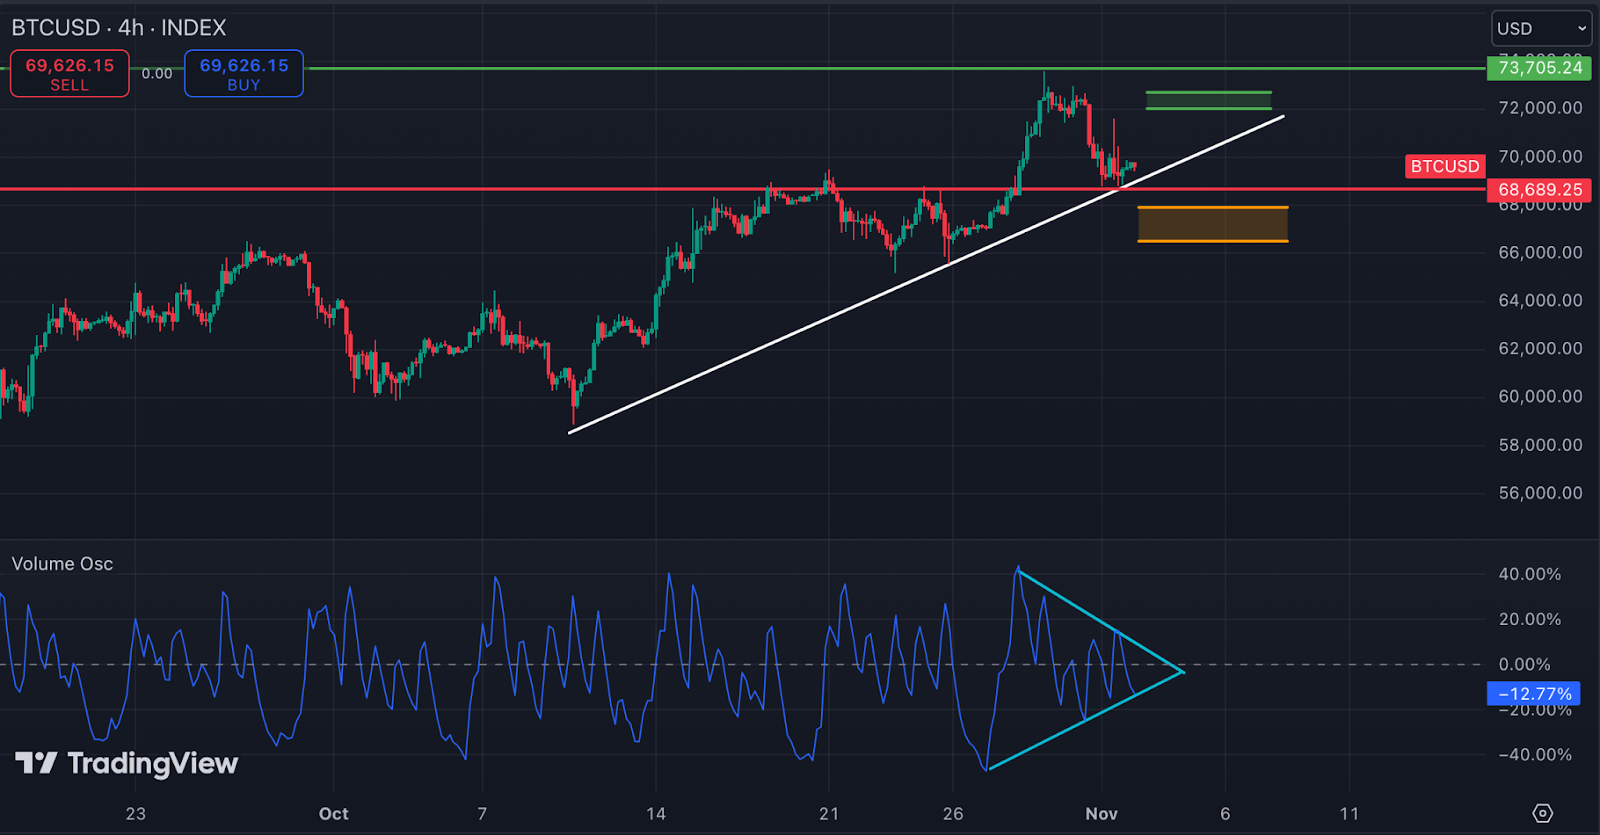
Over the past week, Bitcoin’s price has been flirting with its all-time high (ATH), coming within less than $200 of reaching it. However, Bitcoin failed to break it, consolidating around $73,000, and then dropping to the ascending support line (white line). Declining volume during this phase, highlighted by a symmetrical triangle on the Volume Oscillator, hints at an upcoming strong directional move in both price and volume.
According to VPVR analysis, the closest significant volume clusters are located at $66,500-$68,000 (orange) and $72,000-$72,700 (green). This suggests that Bitcoin could see possible support and resistance in these areas if the asset price bounces off or drops below the ascending support line.
Nevertheless, it is not uncommon for Bitcoin to consolidate near its previous ATH before breaking it decisively. In 2020, for instance, Bitcoin initially stalled near $20,000 before breaking through after a week of consolidation.
Bitcoin’s price is currently approaching its 20-day EMA (yellow line), a dynamic support level for bullish sentiment, indicating that this pullback could be a healthy setup for the next ATH test. Furthermore, the 50-day and 200-day SMAs formed a golden cross (green circle), typically a bullish signal.
Meanwhile, the daily MACD is again on the verge of a bearish crossover, indicating potential downward movement. However, this signal could be considered only if bulls fail to defend the 20-day EMA.
The power of the ATH breakout
Historically, breakouts above ATH levels have been followed by sharp swings in Bitcoin’s volatility:
January 2017 ($1,500 breakout): A 10% weekly drop, followed by a 12% weekly increase.
December 2020 ($20,000 breakout): A 22% weekly increase, with sustained double-digit gains in the following weeks.
March 2024 ($69,000 breakout): A 9% weekly increase, though momentum gradually slowed.
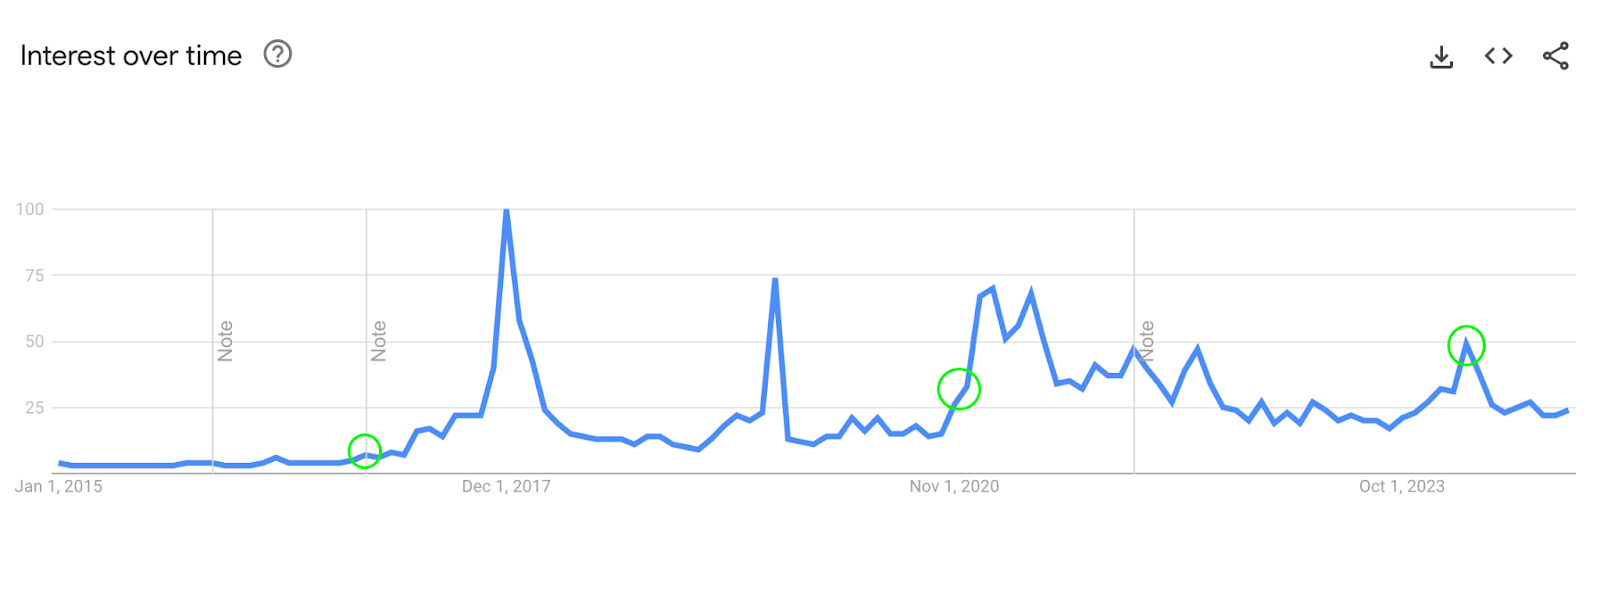
One of the catalysts behind this is that Bitcoin’s approach to ATH levels typically brings an increase in search interest (green circles) and media coverage, amplifying attention on the cryptocurrency. While current search levels are relatively low, a renewed rally could re-engage public interest, though this effect might be somewhat muted given the ATH was already reached earlier this year.
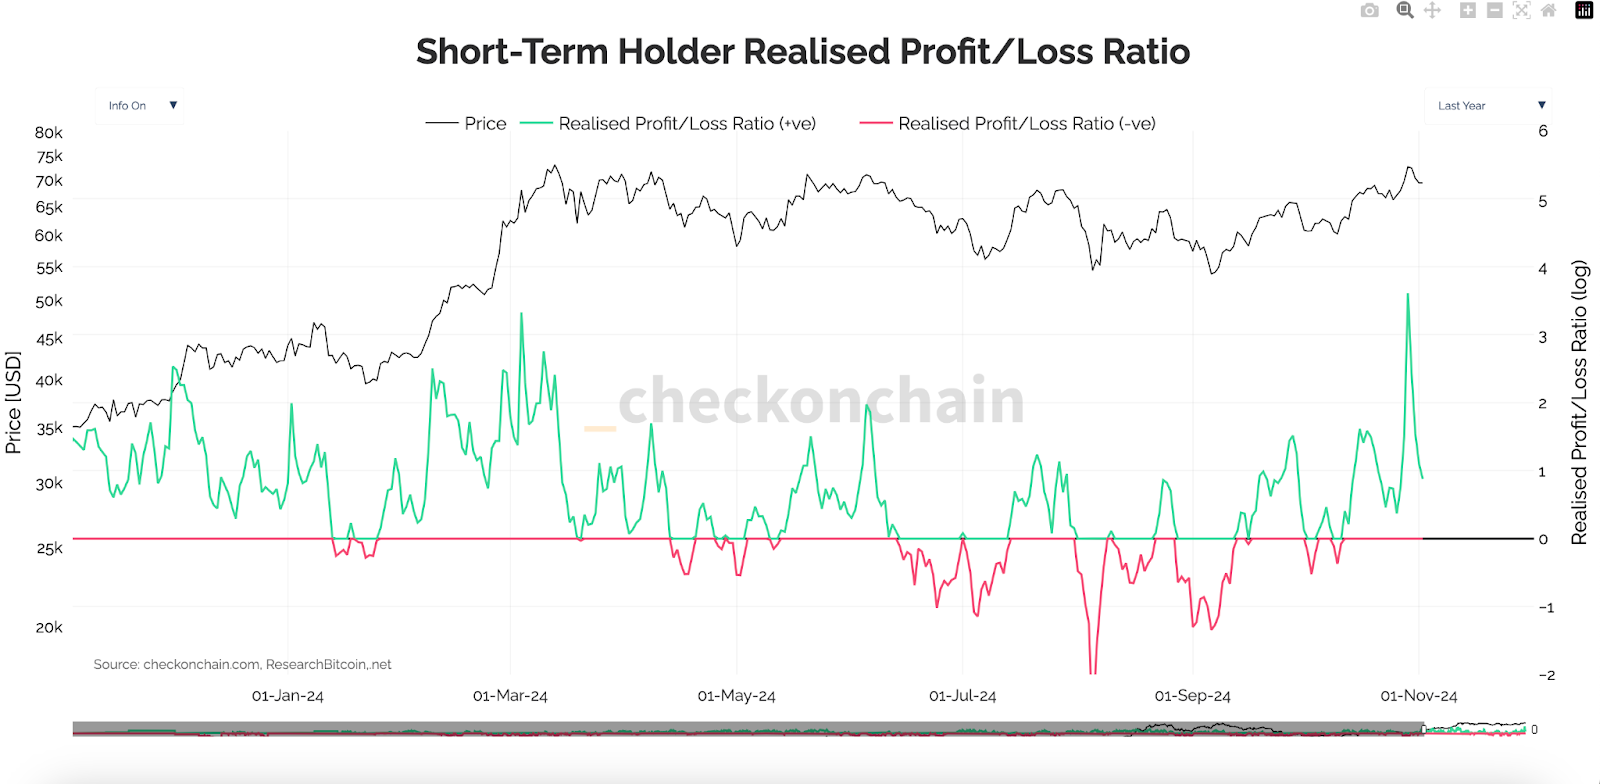
As Bitcoin approached its all-time high, the Short-Term Holder (STH) Realized Profit/Loss Ratio surged to a historic peak, reflecting that recent buyers were taking profits. This level of profit-taking might have acted as a resistance, temporarily holding back Bitcoin from breaking its ATH. However, these dips could attract new buyers, helping sustain market liquidity and supporting future upward momentum.
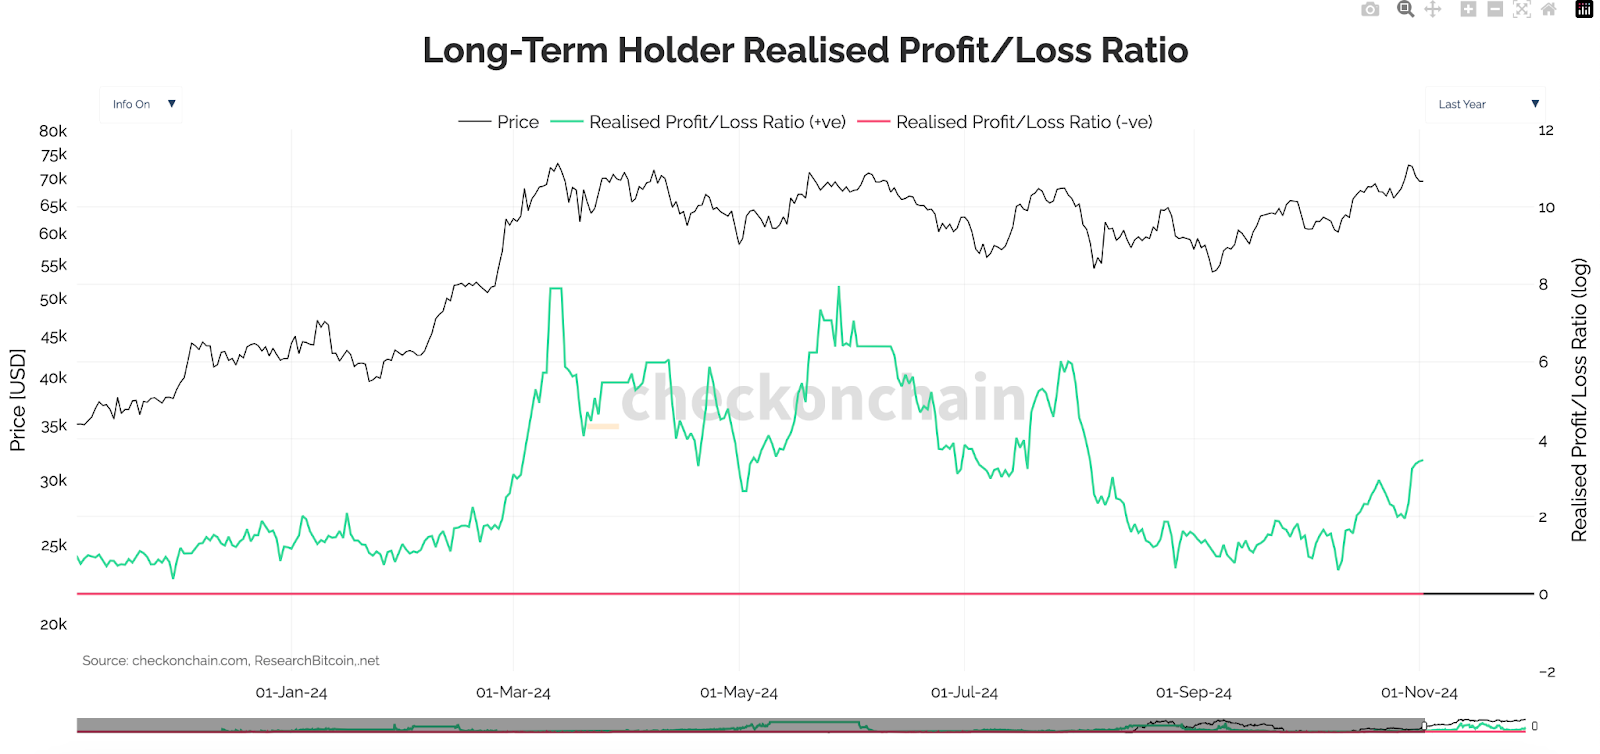
On the other hand, long-term holders (LTH) have shown more restraint, with only a modest increase in profit-taking. This indicates confidence in Bitcoin’s longer-term potential, as LTHs likely wait for more substantial price signals or higher levels before selling.
U.S. elections (November 5): With slim margins between candidates, heightened tension around the election results could introduce short-term volatility in the market. This event might also serve as a trigger for cautious investors waiting on the sidelines to enter the market, potentially boosting market volume shortly after. However, the broader outlook is likely to remain stable regardless of the winner, with increasing signs of a post-halving rally appearing.
Federal Reserve meeting (November 6-7): According to FedWatch, two 25 bps rate cuts in November and December are still the most anticipated outcome. Consequently, this week’s decision may have a limited impact on prices unless the Fed makes an unexpected move. Comments from Fed Chair Jerome Powell will likely be a more impactful factor, especially following Friday’s U.S. non-farm payrolls data, which revealed the weakest job growth since late 2020, along with downward revisions to previous months’ figures.
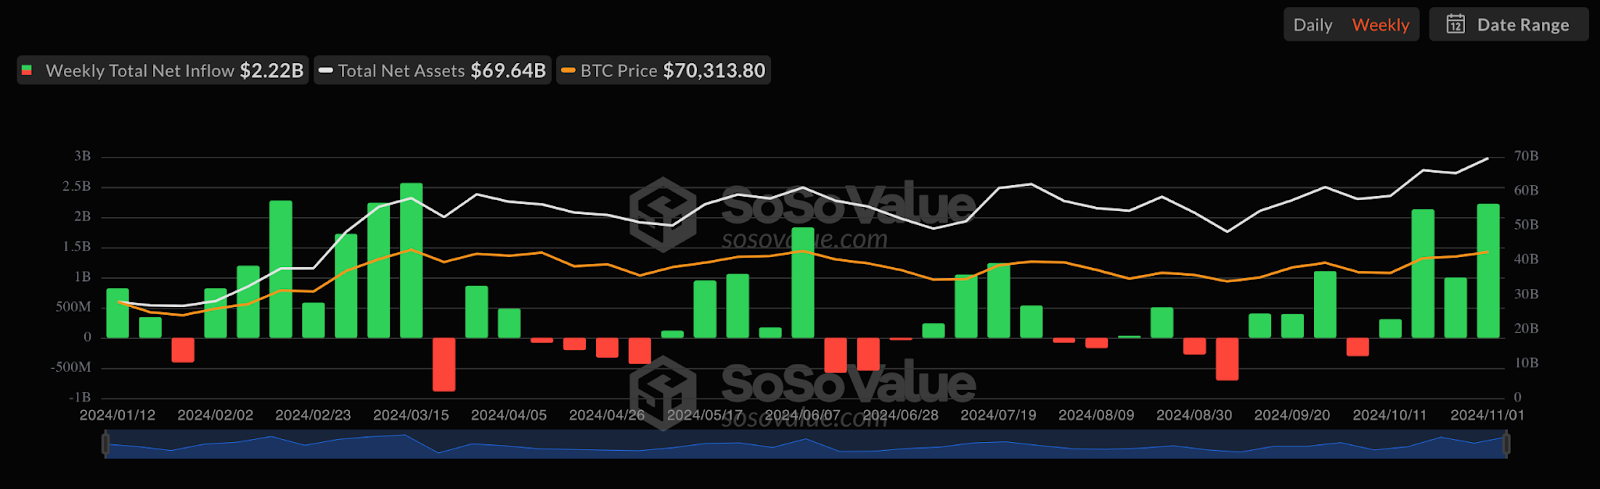
ETF inflows: U.S. spot Bitcoin ETFs reported their largest weekly inflow since March 2024, totaling $2.2 billion. Although these ETFs were only launched in January, notable inflows typically precede price corrections or tapering net inflows. However, this week may be an exception, falling into a “boom or bust” category, as participants could both be extra cautious amid the U.S.-related events, or find the trigger that might have limited previous inflows.
When Bitcoin reached a new all-time high in March 2024, it marked the first time the asset updated its cycle peak just before a halving event. Typically, Bitcoin approaches the 0.382 Fibonacci retracement level around the halving period. However, in 2024, it was near the 0.786 Fibonacci level, hitting this mark approximately six months earlier than usual.
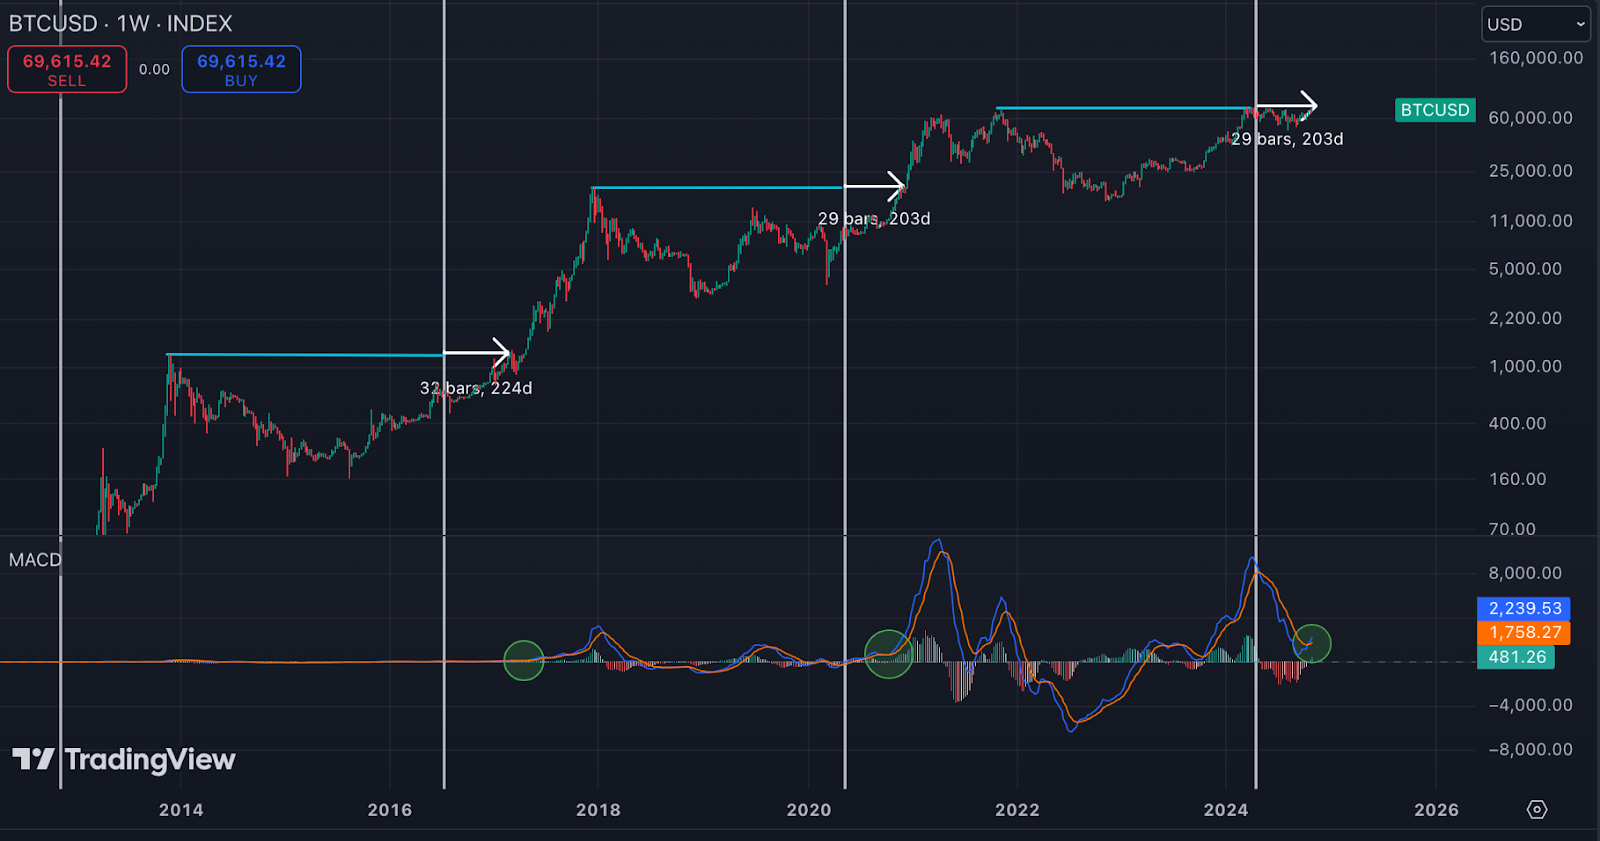
Earlier this year, this unusual scenario caused some indicators to turn “weird,” leading to deviations from past cycle patterns. However, after 8 months of consolidation, Bitcoin now appears more in line with previous cycles. For instance, Bitcoin has surpassed its previous cycle peak and is testing its ATH around the same time as in previous cycles (white arrows). Additionally, the weekly MACD recently formed a bullish crossover (green circle) near the ATH, a pattern that has historically preceded classic post-halving bull runs.
Conclusion
With Bitcoin hovering near its all-time high, the market seems poised for a decisive move. Short-term holders taking profits temporarily capped gains, but technical indicators suggest the bullish potential if the 20-day EMA holds. A solid drop below that level could potentially indicate a short-term delay before Bitcoin challenges its ATH again. However, the longer-term outlook remains primarily bullish, with Bitcoin gradually aligning with previous cycles and potentially preparing for a strong upward move.
The web content provided by CEX.IO is for educational purposes only. The information and tools provided neither are, nor should be construed as, an offer, or a solicitation of an offer, or a recommendation, to buy, sell or hold any digital asset or to open a particular account or engage in any specific investment strategy. Digital asset markets are highly volatile and can lead to loss of funds. The availability of the products, features, and services on the CEX.IO platform is subject to jurisdictional limitations. To understand what products and services are available in your region, please see our list of supported countries and territories. This page includes additional links to information about individual products, and their accessibility.
Bitcoin appears poised to reach $100,000 in the short term, though a pullback beforehand could provide a stronger foundation for its continued upward trajectory.
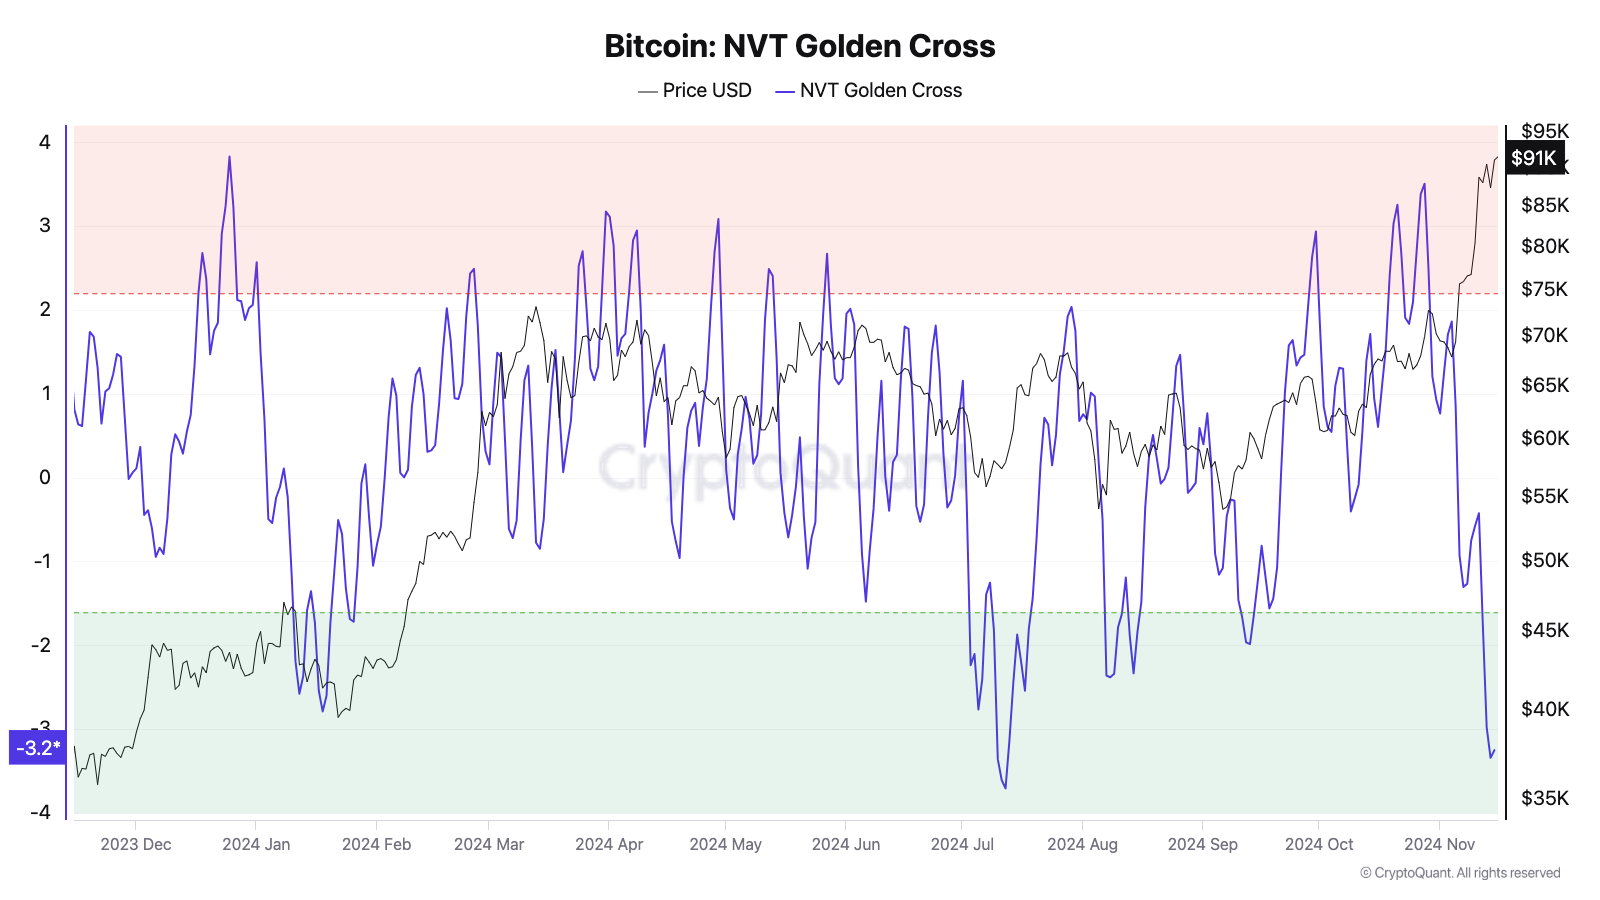
The NVT Golden Cross divergence points to transaction volume growth and potential undervaluation, reinforcing a bullish outlook.
While retail investors have been taking profits near the all-time high, wallets holding 100-1,000 BTC have been leading in accumulation.
Weekly outlook
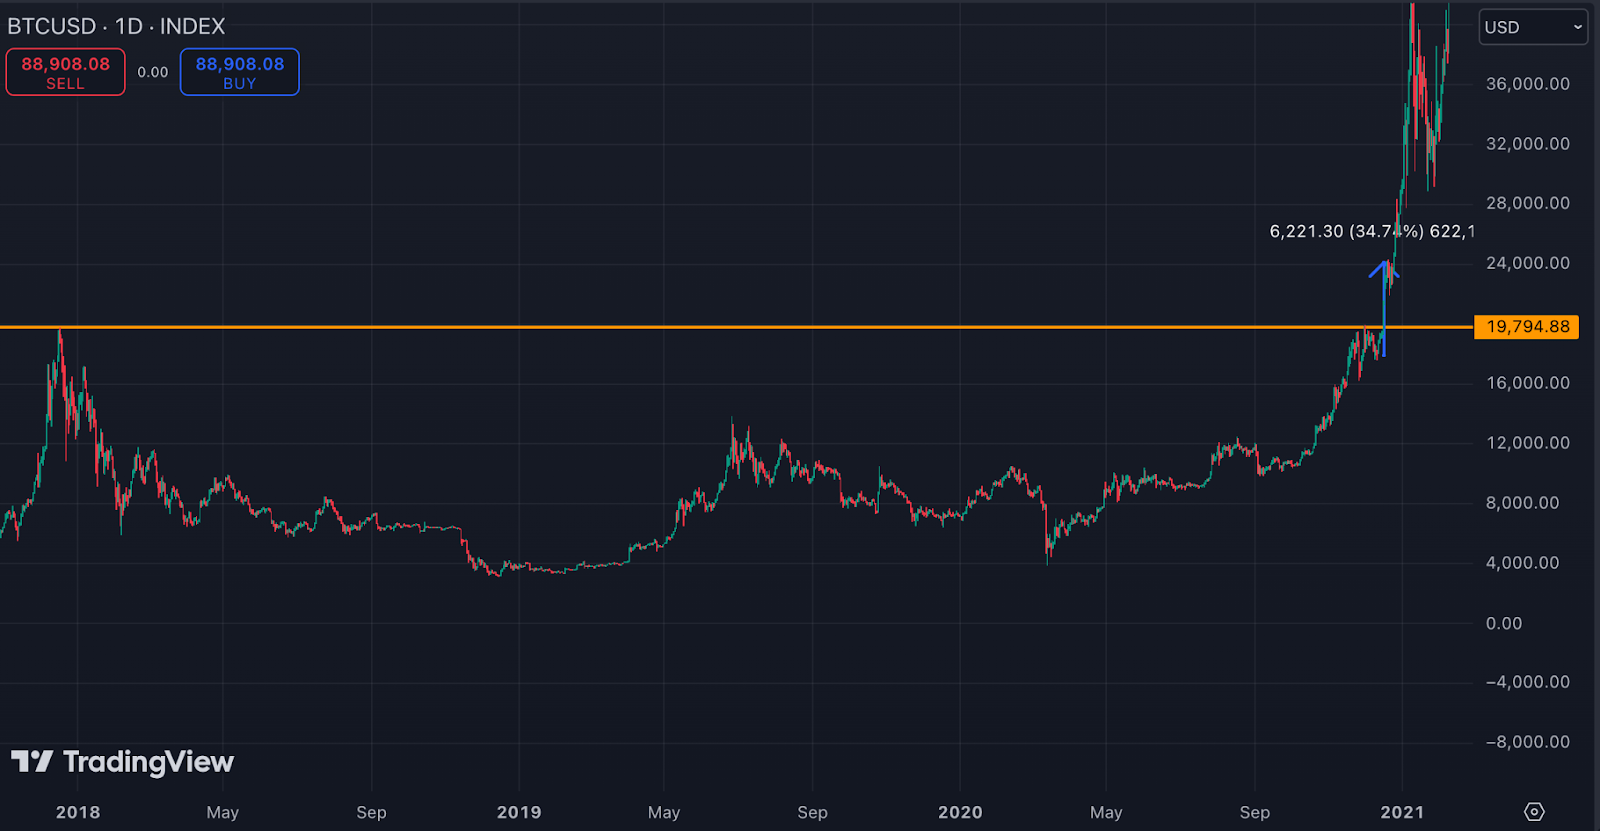
Bitcoin’s new all-time high
November continues to solidify its reputation as one of Bitcoin’s strongest months, with the cryptocurrency recording a 30% price surge so far. This rally has been largely tied to the “Trump trade,” reflecting optimism about the president-elect’s crypto-friendly promises. However, historical data suggested that Bitcoin’s broader trajectory would likely have remained positive regardless of the election outcome. Moreover, the election primarily served as a psychological barrier, delaying investment decisions until its conclusion.
Nevertheless, Bitcoin hit a new all-time high near $93,400 following U.S. CPI data that showed inflation rising by 0.2% to 2.6%. Shortly after, Fed Chair Jerome Powell’s comment that “the economy is not sending any signals that we need to be in a hurry to lower rates.” This briefly pushed Bitcoin below $90,000 and decreased chances of the rate cut in December
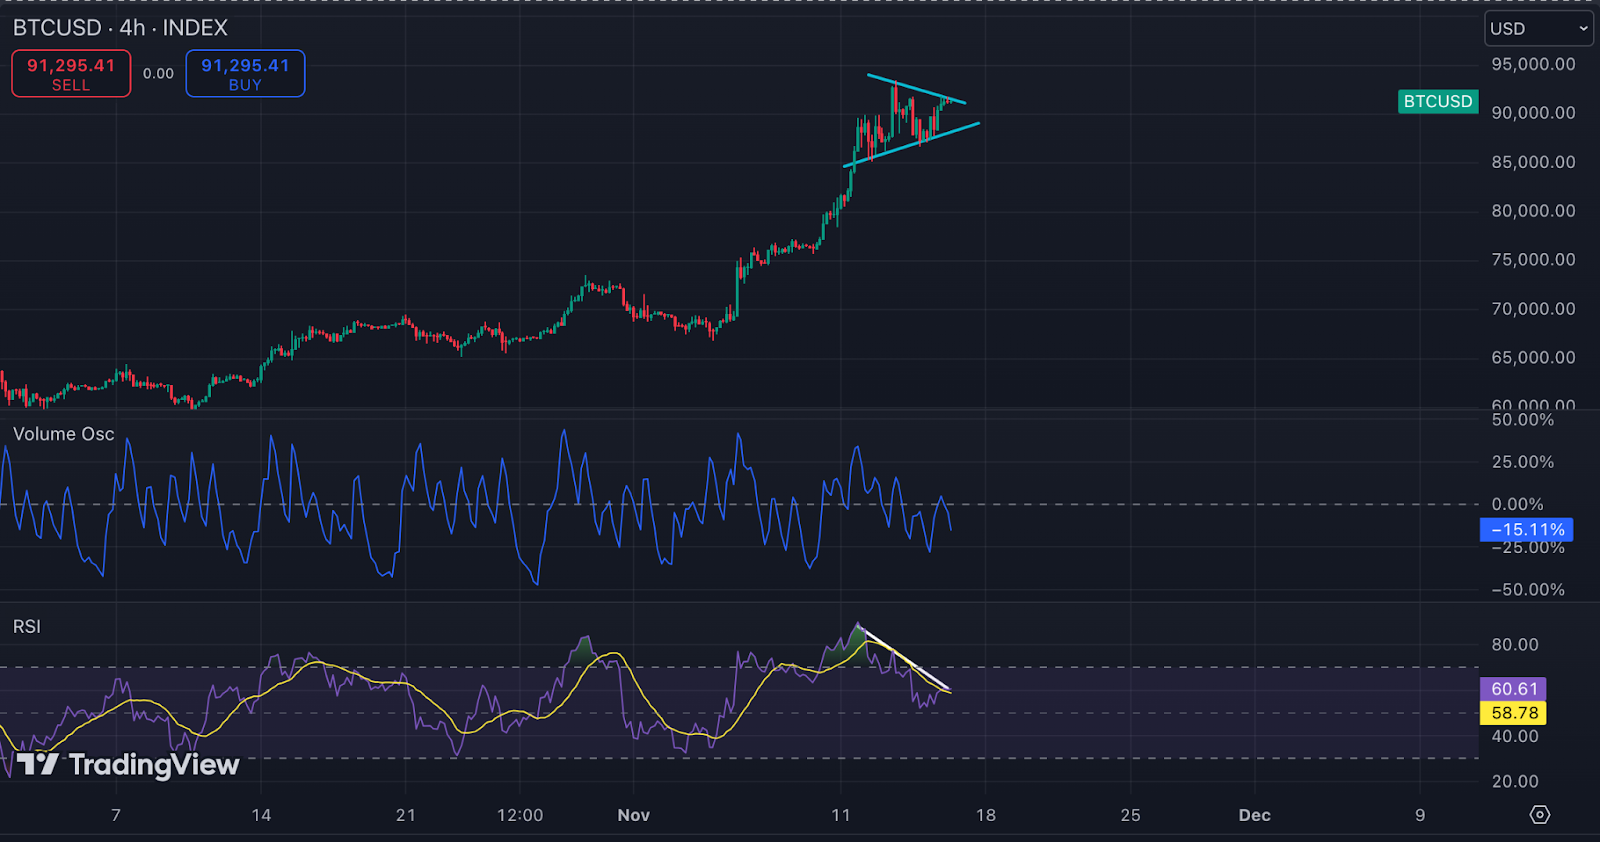
As a result, Bitcoin’s price entered a consolidation phase, forming a symmetrical triangle with signs of a bullish pennant pattern. The Volume Oscillator has been declining during this phase, showing upticks on upward moves, indicating that bulls might still have the upper hand. The RSI on a 4-hour chart has been in a descending trend, but a solid breakout above the resistance line (white line) could hint at further continuation of the bullish move.
Notably, this price action resembles Bitcoin’s performance in December 2020, when Bitcoin also jumped by 30% amid the breakout of an all-time high. Back then, the asset experienced a week-long consolidation before resuming its upward trend.
NVT Golden Cross divergence
As Bitcoin reached new highs, the NVT Golden Cross showed a divergence, falling below -1.6. This could signal either a lag in transaction volume relative to price appreciation (bearish sign), or potential undervaluation (bullish sign).
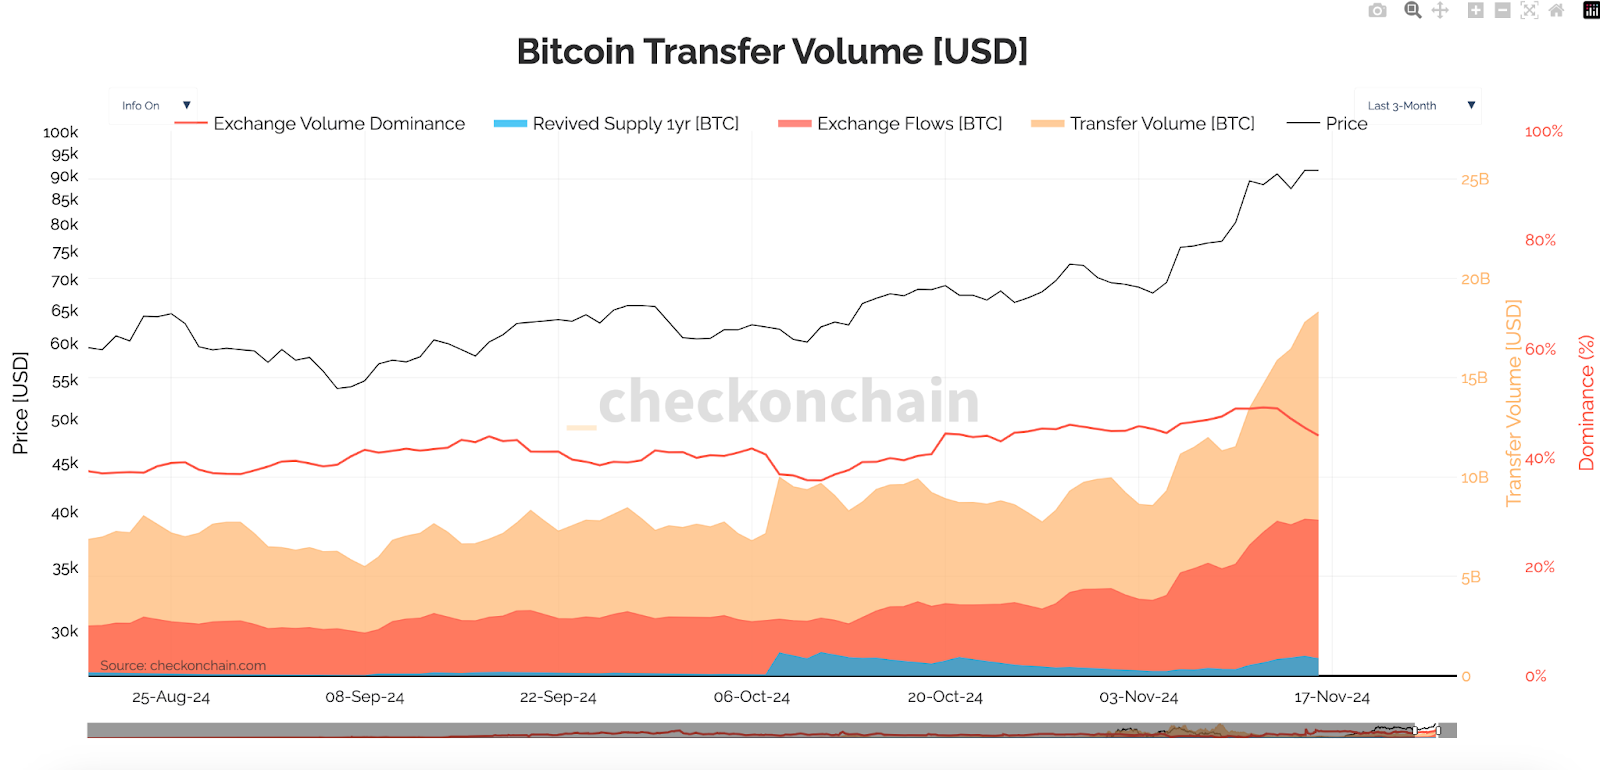
In November, USD-denominated transfer volume doubled, while BTC-denominated one increased by 40%. This suggests a combination of organic network activity and price-driven demand, potentially providing a more solid foundation for further price gains. Thus, the NVT Golden Cross divergence leans toward a bullish signal, indicating that the current pause in momentum may be temporary, with further upward movement likely once this consolidation phase concludes.
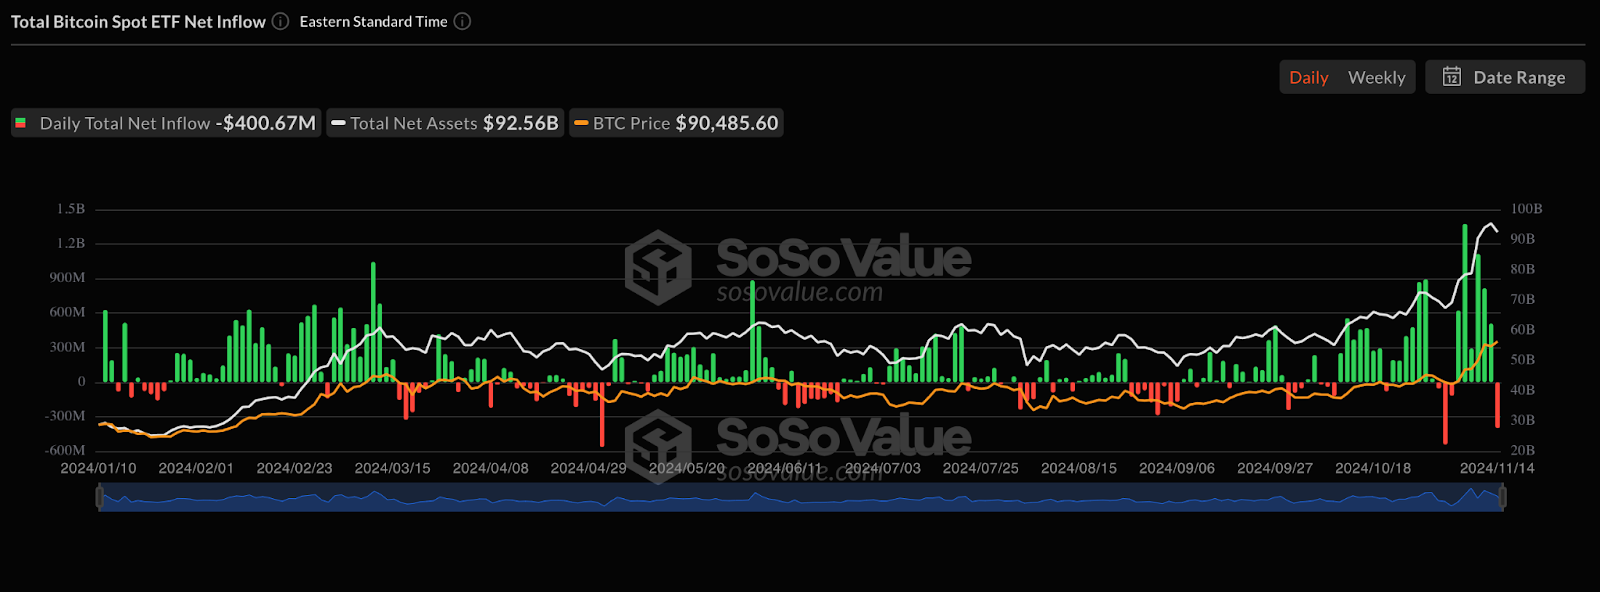
U.S. spot Bitcoin ETFs posted the sixth week of consecutive inflows, totaling $2.04 billion. However, the bullish trend softened after a record daily inflow of $1.3 billion on November 7, culminating in a $400 million outflow last Thursday. Historically, such significant outflows have coincided with local bottoms, suggesting the possibility of renewed upward momentum unless outflows persist.
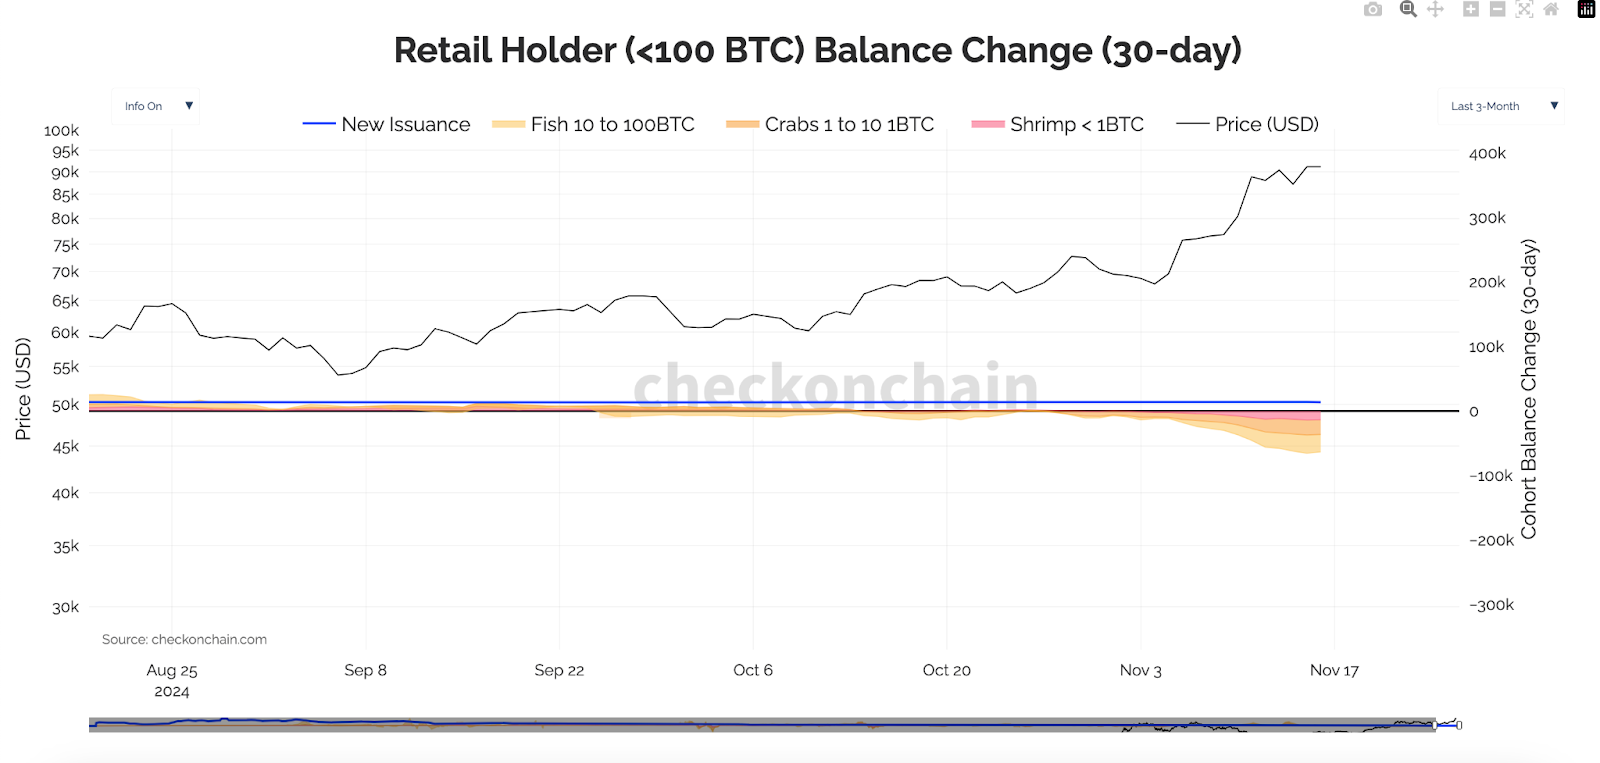
Retail investors led in profit-taking near the all-time high
Over the past month, as Bitcoin’s price climbed, retail wallets (<100 BTC) consistently showed a negative 30-day balance change, which accelerated after breaking the all-time high. This suggests sustained selling activity, which has been exceeding other wallet holder cohorts.
In contrast, sharks (100-1,000 BTC) steadily accumulated Bitcoin throughout the period, capitalizing on the upward price momentum. Whales (>1,000 BTC) initially increased their balances before shifting to net outflows, indicating redistribution. Exchange wallets continued experiencing outflows, with Bitcoin reserves decreasing by 2.5% over the last week.
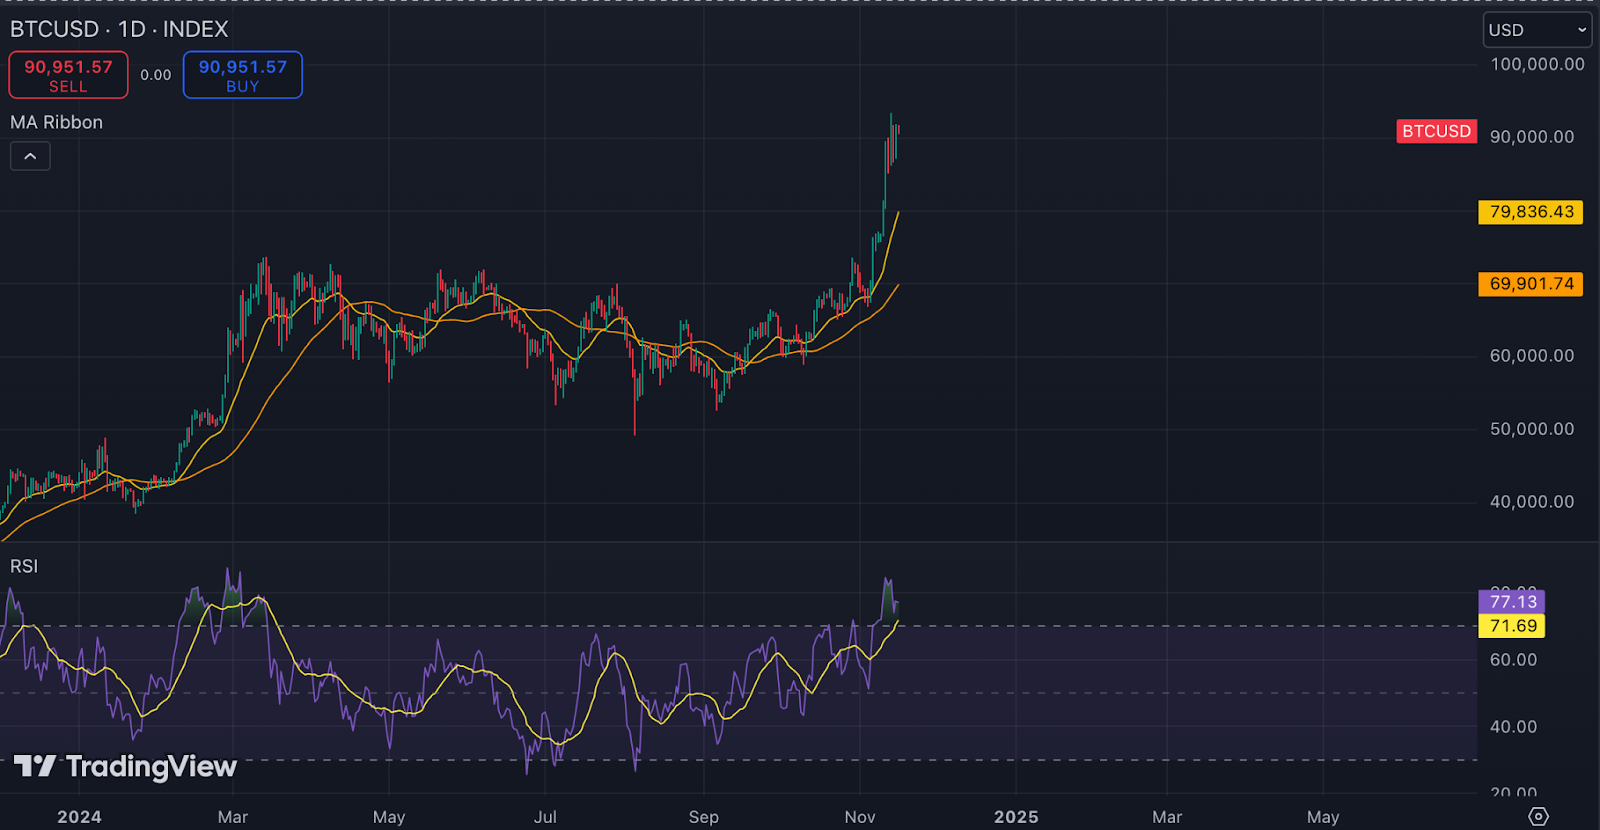
Historically, the 20-day EMA (yellow line) and 50-day SMA (orange line) acted as key dynamic support lines throughout post-halving rallies. For instance, during Bitcoin’s climb from $10,000 to $60,000 in 2020-2021, these levels acted as turning points, reestablishing bullish momentum after local pullbacks. Despite recent consolidation, Bitcoin currently trades far above these averages, suggesting that a pullback could provide a healthier foundation for its upward trajectory.
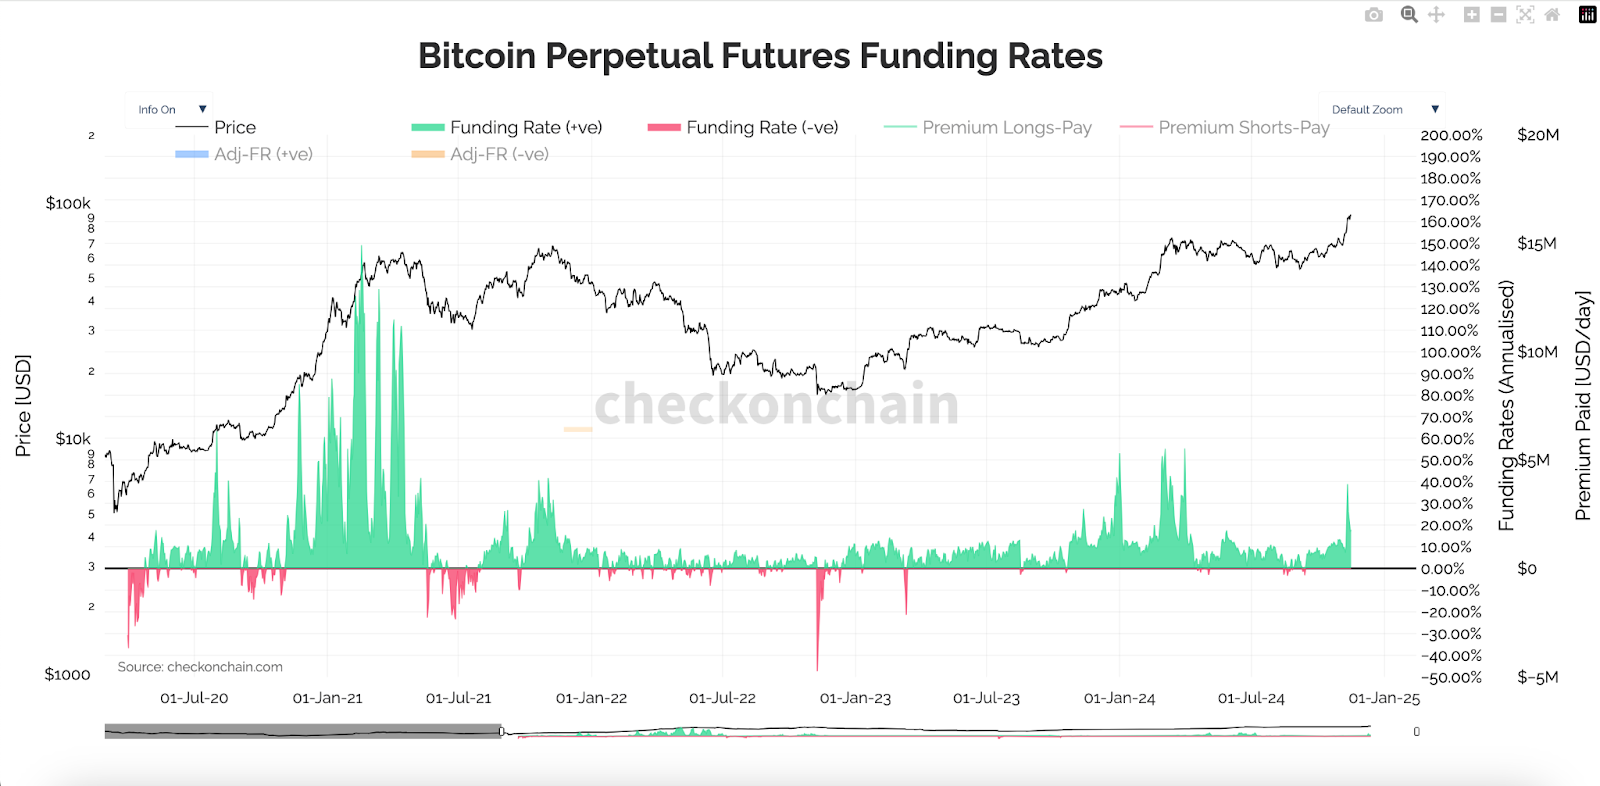
Furthermore, Bitcoin futures and options markets have reached or approached all-time highs in both volume and open interest. Perpetual futures funding rates and long position premiums are at their highest levels since March. Typically, such spikes preceded pullbacks or short-term consolidations during bull runs. If the correction unfolds, the 20-day EMA could act as a potential target for bears.
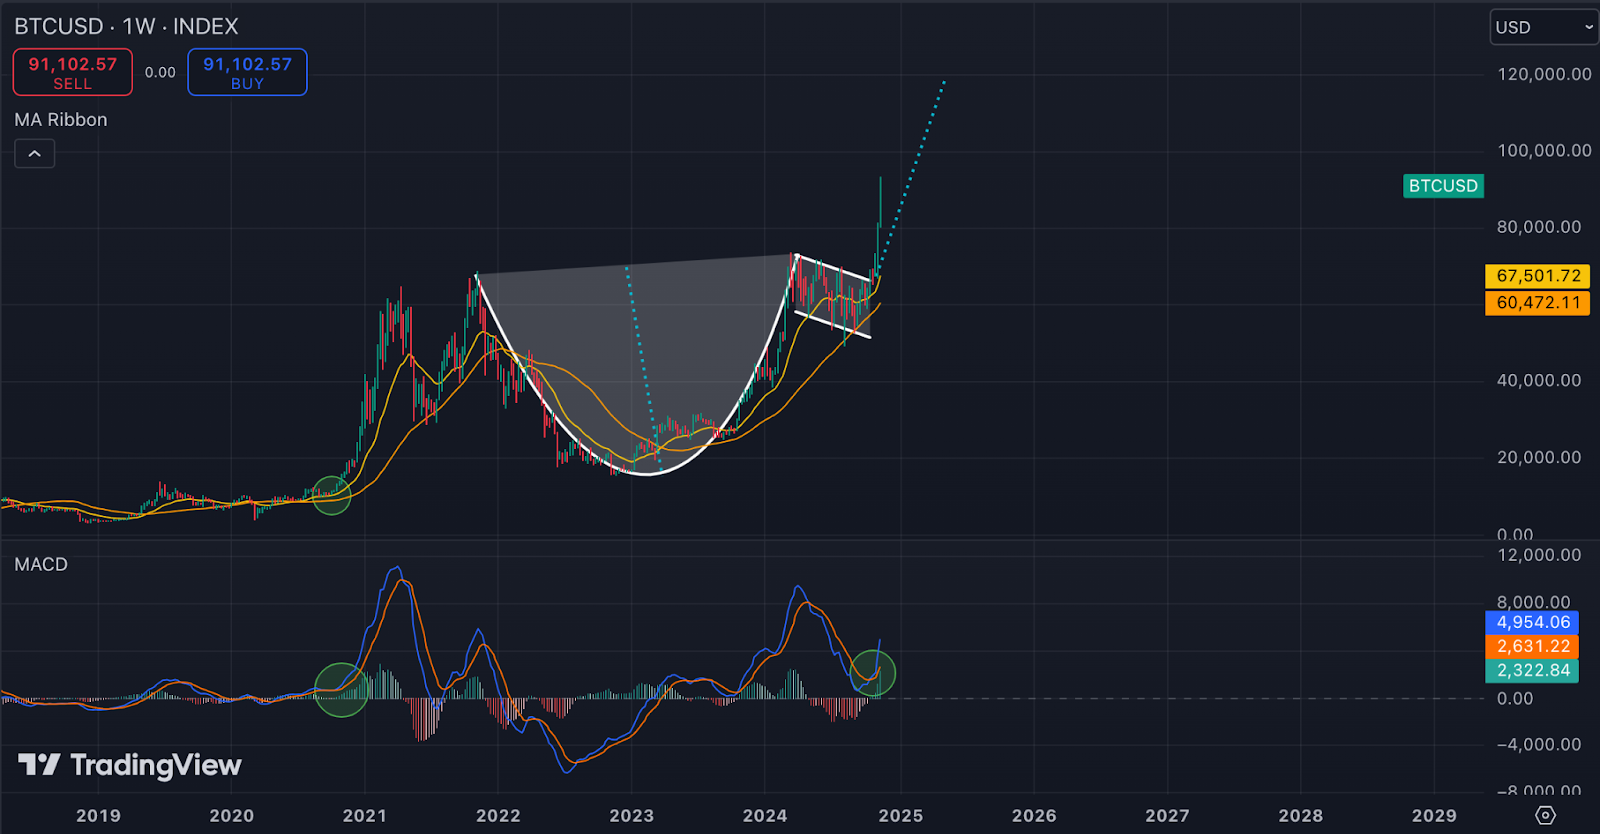
Despite the possibility of a pullback, Bitcoin seems to be in a classic post-halving rally. The asset formed a Cup and Handle pattern on the weekly chart suggesting a target of $120,000 if fully realized. The weekly MACD has also produced a bullish crossover (green circle), historically a precursor to prolonged rallies.
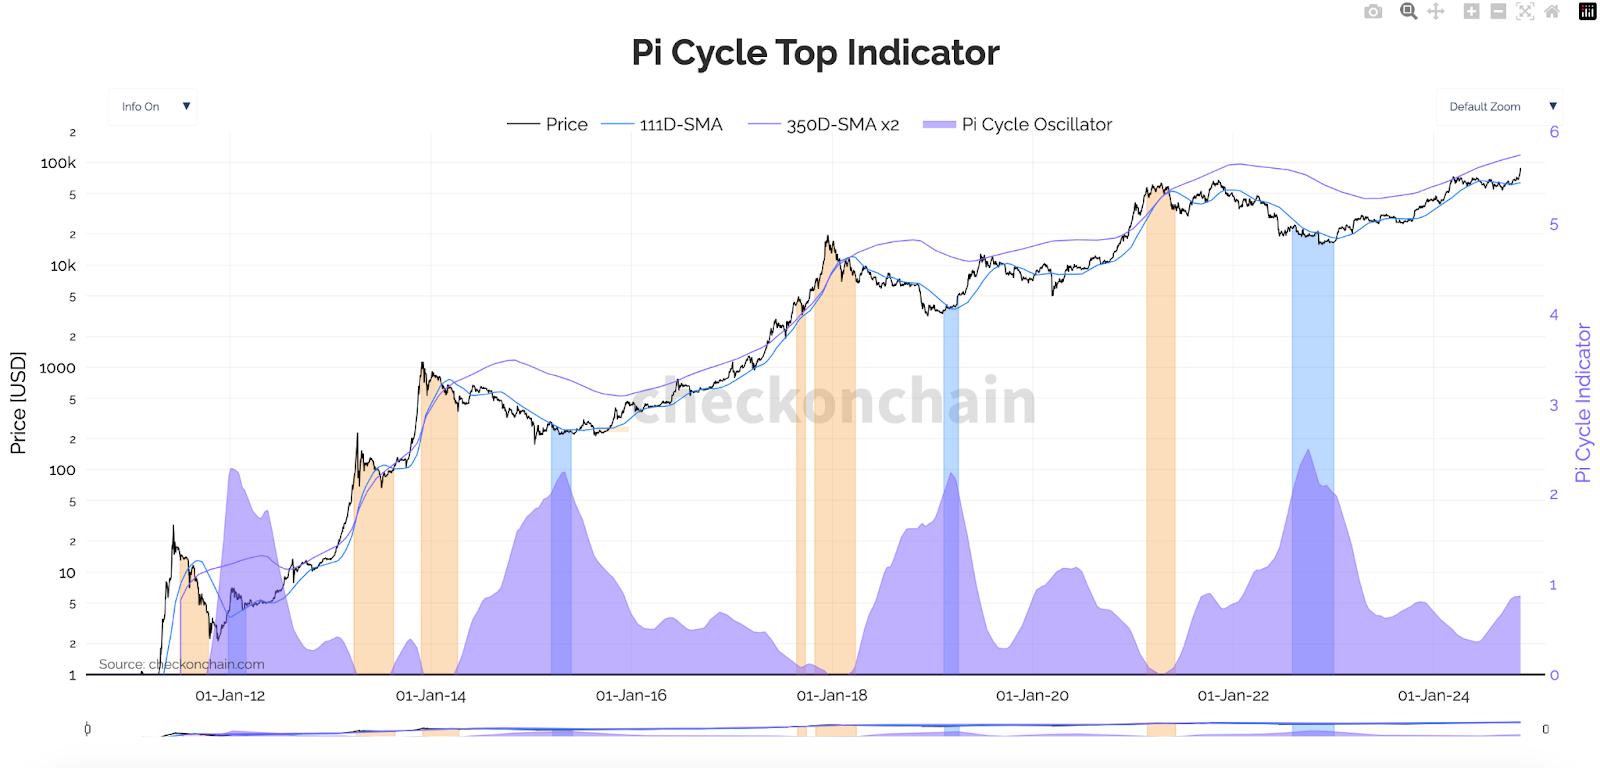
In turn, the Pi Cycle Oscillator is currently at levels similar to Q4 of previous halving years. From this position, it has historically taken Bitcoin about 3-6 months to surpass the 350-day SMA x2, which currently stands near $120,000. Notably, when the 111-day SMA crosses the said moving average, this event historically coincided with the formation of cycle peaks.
Bitcoin is well-positioned to continue its post-halving rally, showing a convergence of macroeconomic factors, institutional interest, and robust on-chain activity. A bullish scenario suggests that a $100,000 mark could be broken in the coming weeks, but a stronger correction may follow in this case. Conversely, a bearish scenario suggests a retest of the 20-day EMA, which, while slowing the pace to a six-digit price, could strengthen the foundation for a more sustainable bull run.
The web content provided by CEX.IO is for educational purposes only. The information and tools provided neither are, nor should be construed as, an offer, or a solicitation of an offer, or a recommendation, to buy, sell or hold any digital asset or to open a particular account or engage in any specific investment strategy. Digital asset markets are highly volatile and can lead to loss of funds. The availability of the products, features, and services on the CEX.IO platform is subject to jurisdictional limitations. To understand what products and services are available in your region, please see our list of supported countries and territories. This page includes additional links to information about individual products, and their accessibility.
Over the 11 months of 2024, the memecoin sector saw a 330% increase in market cap and a 979% surge in trading volume, outpacing Bitcoin by 2 and 9 times, respectively.
Memecoins’ share in the altcoin market size and volume surged by over 182% and 350%, respectively.
AI and cat-themed memecoins emerged as the fastest-growing categories in market size.
Most political memecoins lost 80% of their trading volume following the U.S. elections.
TON became the fastest-growing network for memecoins, with trading volume soaring 750-fold over the last six months.
In 2024, a 10% move in Bitcoin’s price typically triggered a 28.9% average volatility among top memecoins.
Introduction
When reviewing the list of top gainers and losers in 2024, memecoins are likely to dominate both categories. This is due to their staggering issuance: over 60,000 memecoins are created daily, with nearly half launched on Pump.fun. This surge has made entire networks increasingly reliant on memecoins; on Solana, for instance, they account for nearly 80% of DEX volume. The expansion shows no signs of slowing, as networks like Tron and Sui have recently joined the list of major memecoin “benefactors.”
The appeal is simple: frequentlyemergedstories of wallets turning a few hundred dollars into millions with investments in some “LOL” token sound more compelling for those who might not want to stick in the space for a while, or look for quick profits. As memecoins dominate in crypto-related search interest, they are becoming the new hub for retail traders, even surpassing Bitcoin in attention.
There’s no question that memecoins have been among the most influential crypto narratives this year. But just how impactful have they become? To find out, we examined the 2024 performance of the memecoins sector to assess their rising market share and behavior during high-volatility events.
Methodology
The data used for this research consists of publicly available information from CoinMarketCap, CoinGecko, CoinGlass, and Artemis. The performance of certain digital assets has been adjusted using data provided by CEX.IO Spot Trading, a trading platform, which offers deep liquidity across 300+ pairs thanks to liquidity aggregated from top-tier crypto exchanges under one roof.
The observation period for this study was focused on 11 full months of 2024 to show the monthly development of the memecoin sector. As for memecoins and categories established after the March 2024 frenzy, the observation period has primarily been June-November, or the last 6 months.
Part 1: The Weight of Memecoins in the Crypto Market
Doubled Share in Market Cap
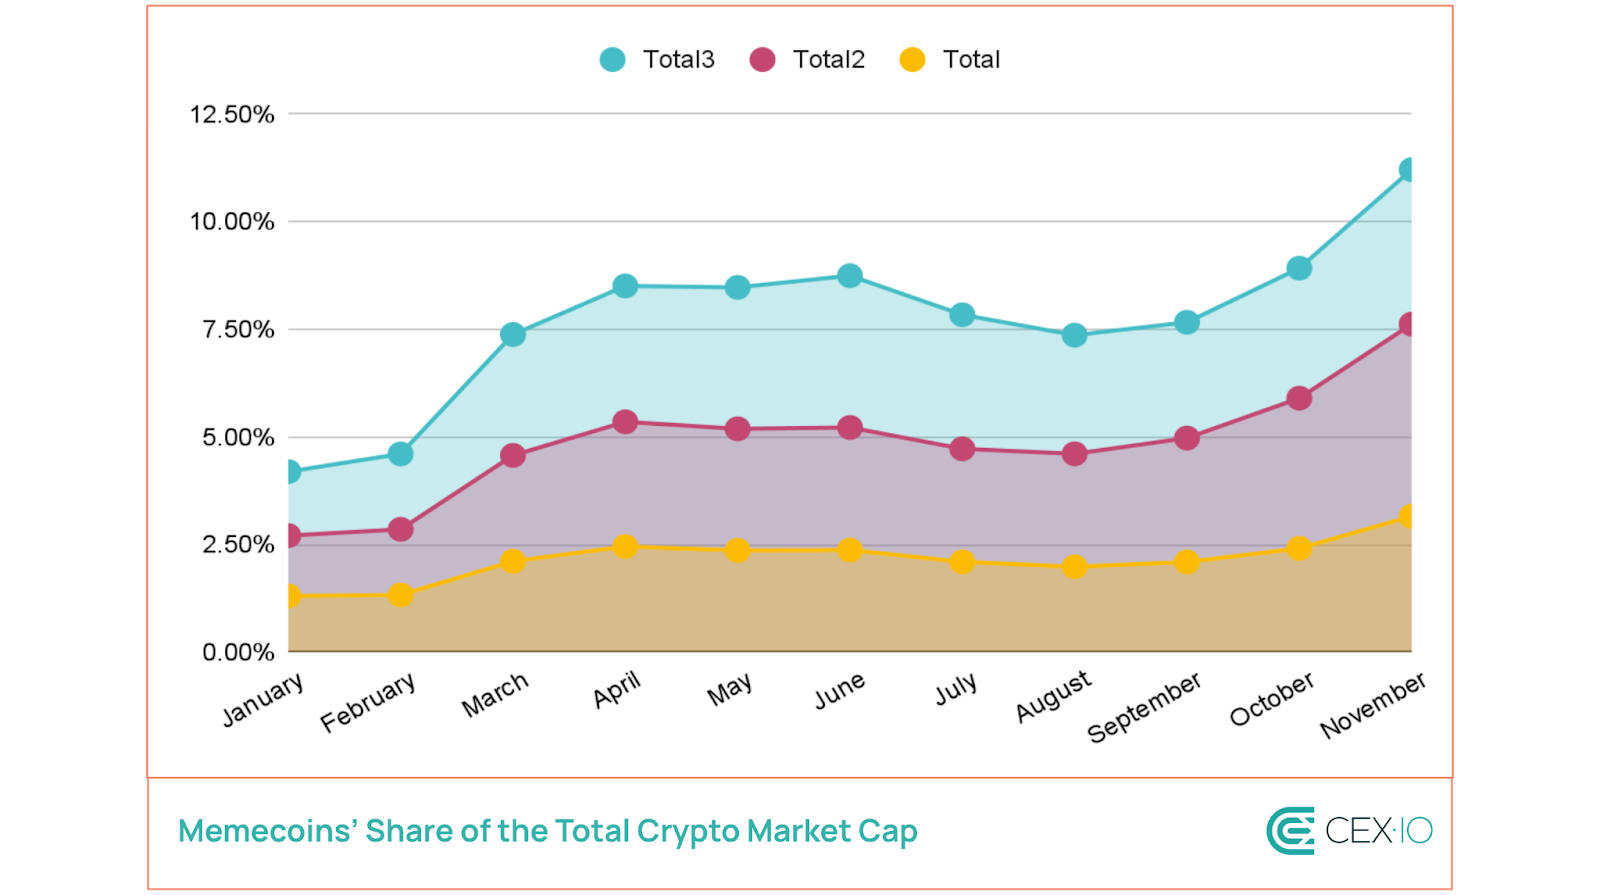
The memecoin sector registered a 330% increase in its combined market cap in 11 months of 2024. This increase is 3 times larger than Bitcoin’s and 9 times larger than Ethereum’s over the same period. As a result, the memecoin sector substantially boosted its share within the crypto market:
In total crypto market cap — +142%, from 1.3% to 3.16%.
In total crypto market cap excluding Bitcoin (Total2)— +182%, from 2.71% to 7.62%.
In total crypto market cap excluding Bitcoin and Ether (Total3) — +167%, from 4.2% to 11.21%.
Most of this growth occurred following the memecoin frenzy in March, which became a turning point in terms of memecoin issuance. For instance, in February, the daily number of memecoins deployed on Pump.fun was limited to a few dozen, but this figure skyrocketed to thousands starting March. This frenzy was driven by the broader crypto rally and the growing feasibility of creating new memecoins. The cost-efficiency of establishing markets on decentralized exchanges (DEXs) on Solana and Base networks further amplified the surge.
Tenfold Increase in Trading Volume
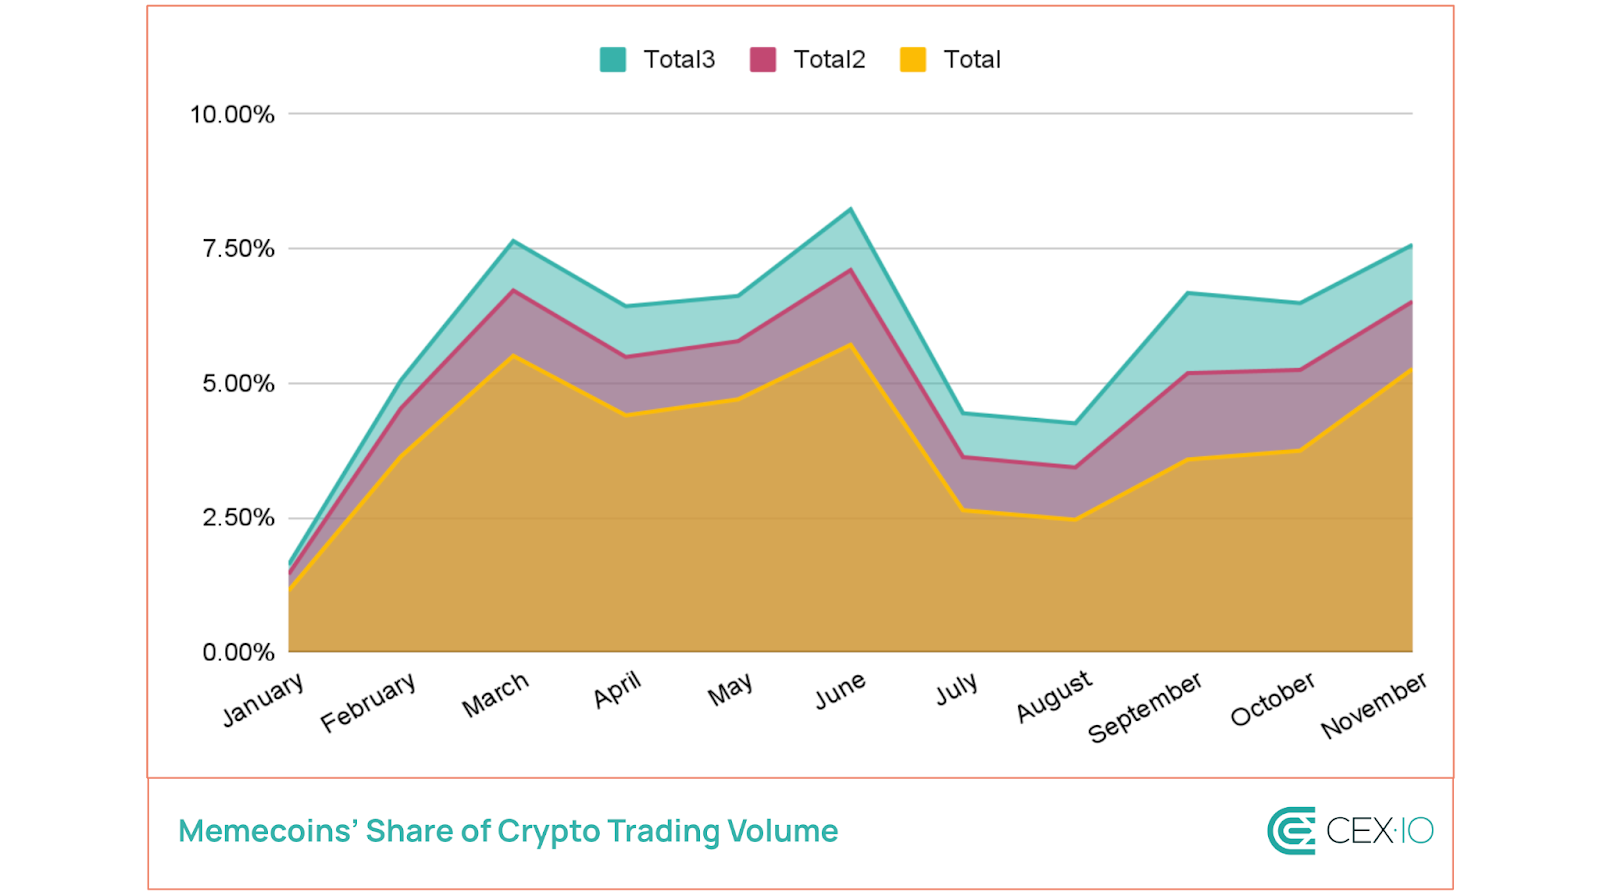
Memecoins experienced even more pronounced growth in trading volume, which rose by 979% on average over the last 11 months, further elevating their position in the broader crypto market:
A 362% increase in the general crypto trading volume, now representing around 5.27%.
A 350% growth in altcoin (Total2) volume, reaching 6.52%.
A 367% surge in Total3 (excluding Bitcoin and Ether) volume, hitting 7.57% in November.
In March and November, memecoin volume almost doubled, while most other sectors lagged behind. In June, while most digital assets experienced a steep decline in volume, memecoins retained significant interest, temporarily securing 5.71% of total crypto trading volume.
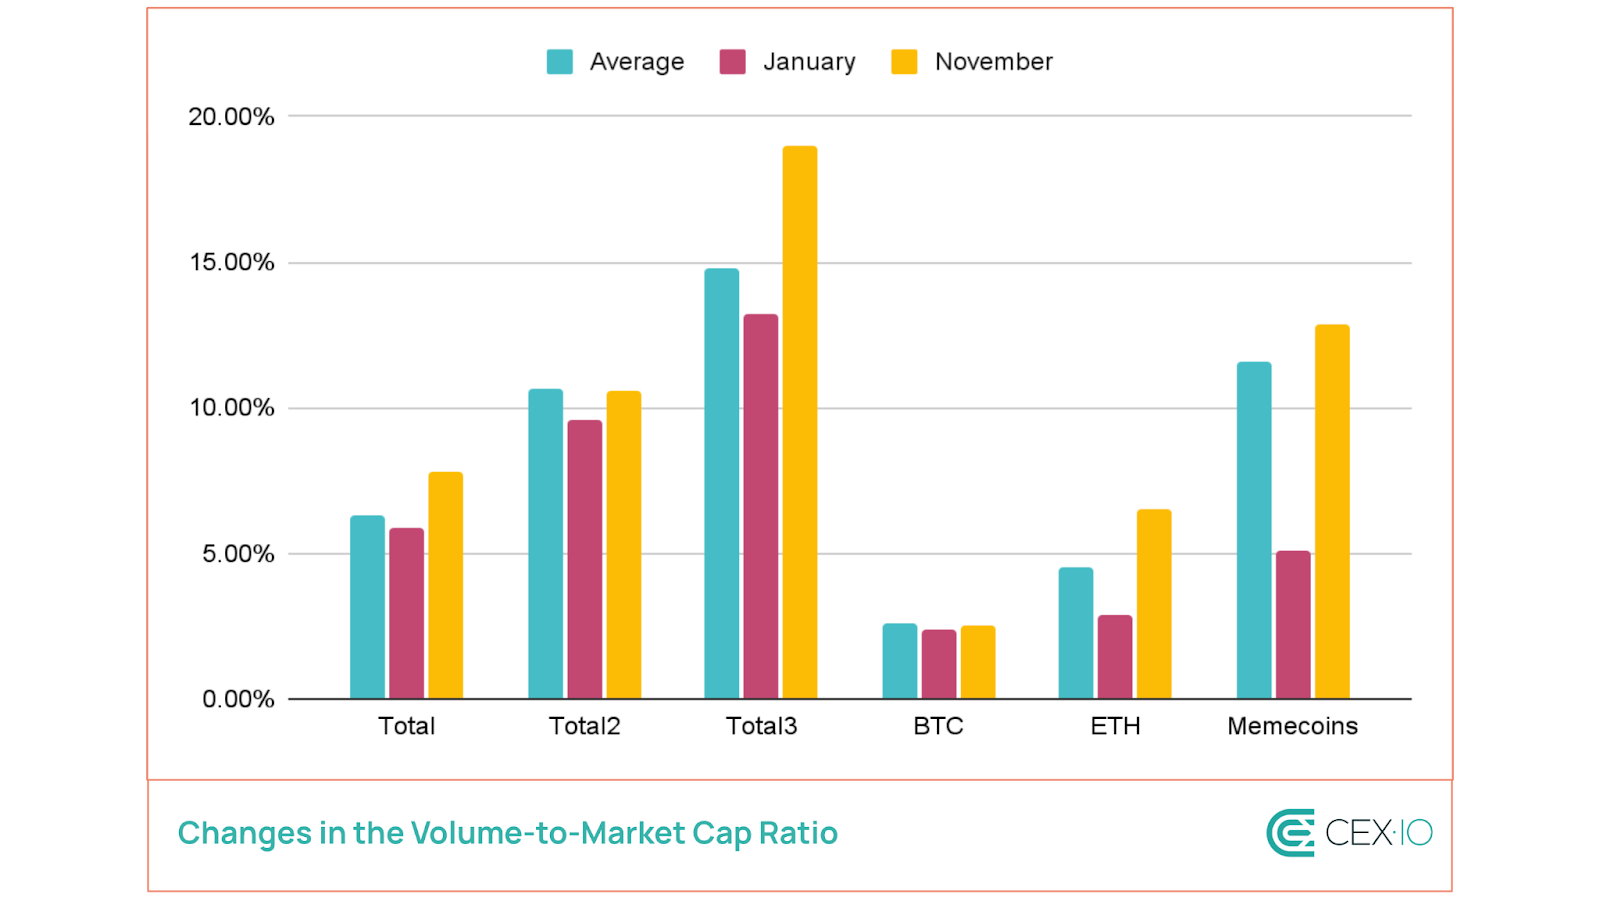
Memecoins’ Volume/MCap Outpaces Most of the Market
In 2024, the Volume/MCap ratio saw substantial growth across most cryptocurrencies. Memecoins outperformed the altcoin market (Total2), with their Volume/MCap ratio jumping 150% to reach an average of 11.55%. A high Volume/MCap ratio typically signals greater trading activity relative to market size, but it also tends to increase susceptibility to sudden price swings.
Memecoins’ Volume/MCap ratio momentum primarily ramped up after the March frenzy. At its peak, the Volume/MCap ratio across the memecoin sector soared past 50%, showcasing rapid speculation. In addition, in 2024, it became more common for memecoins’ trading volume to briefly exceed their market cap, a rare occurrence among assets with market caps over $100 million (excluding major stablecoins).
Part 2: Increased Memecoin Diversity in the Crypto Market
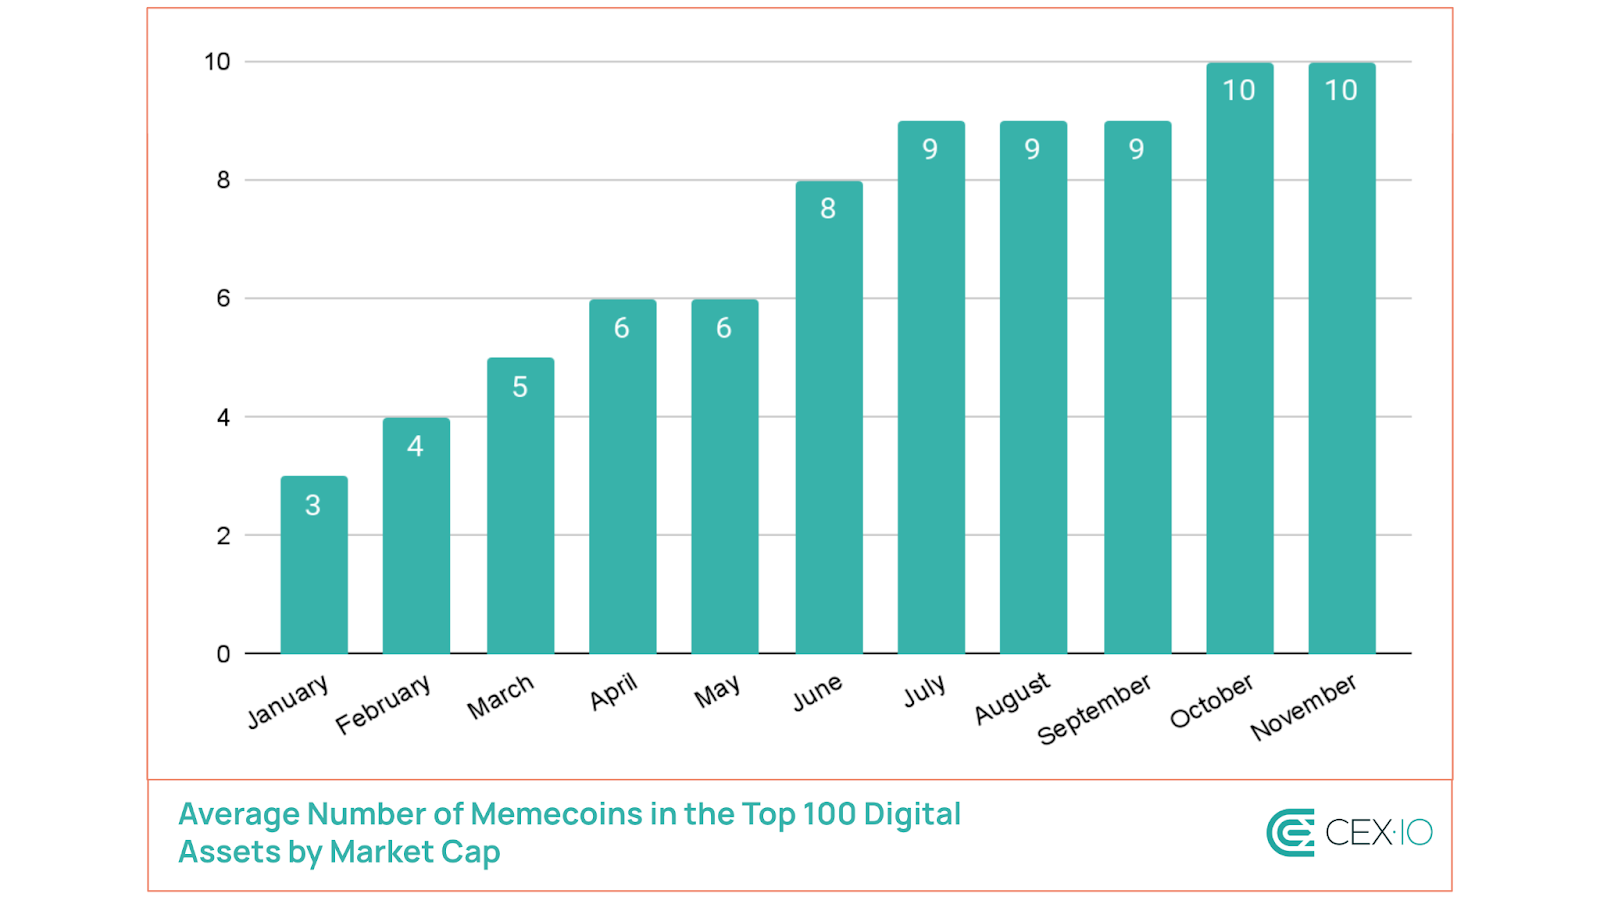
Rising Dominance Among Leading Digital Assets
In 2021, memecoin volume and market cap were dominated by just two assets: Dogecoin and Shiba Inu. By contrast, 2024 has seen a surge in top-ranking memecoins, with the average number in the top 100 tripling from 3 in January to 10 in November. Furthermore, there has been a consistent rise each month, reflecting the resilience of interest in the memecoin sector and its expanding influence, despite general volatility.
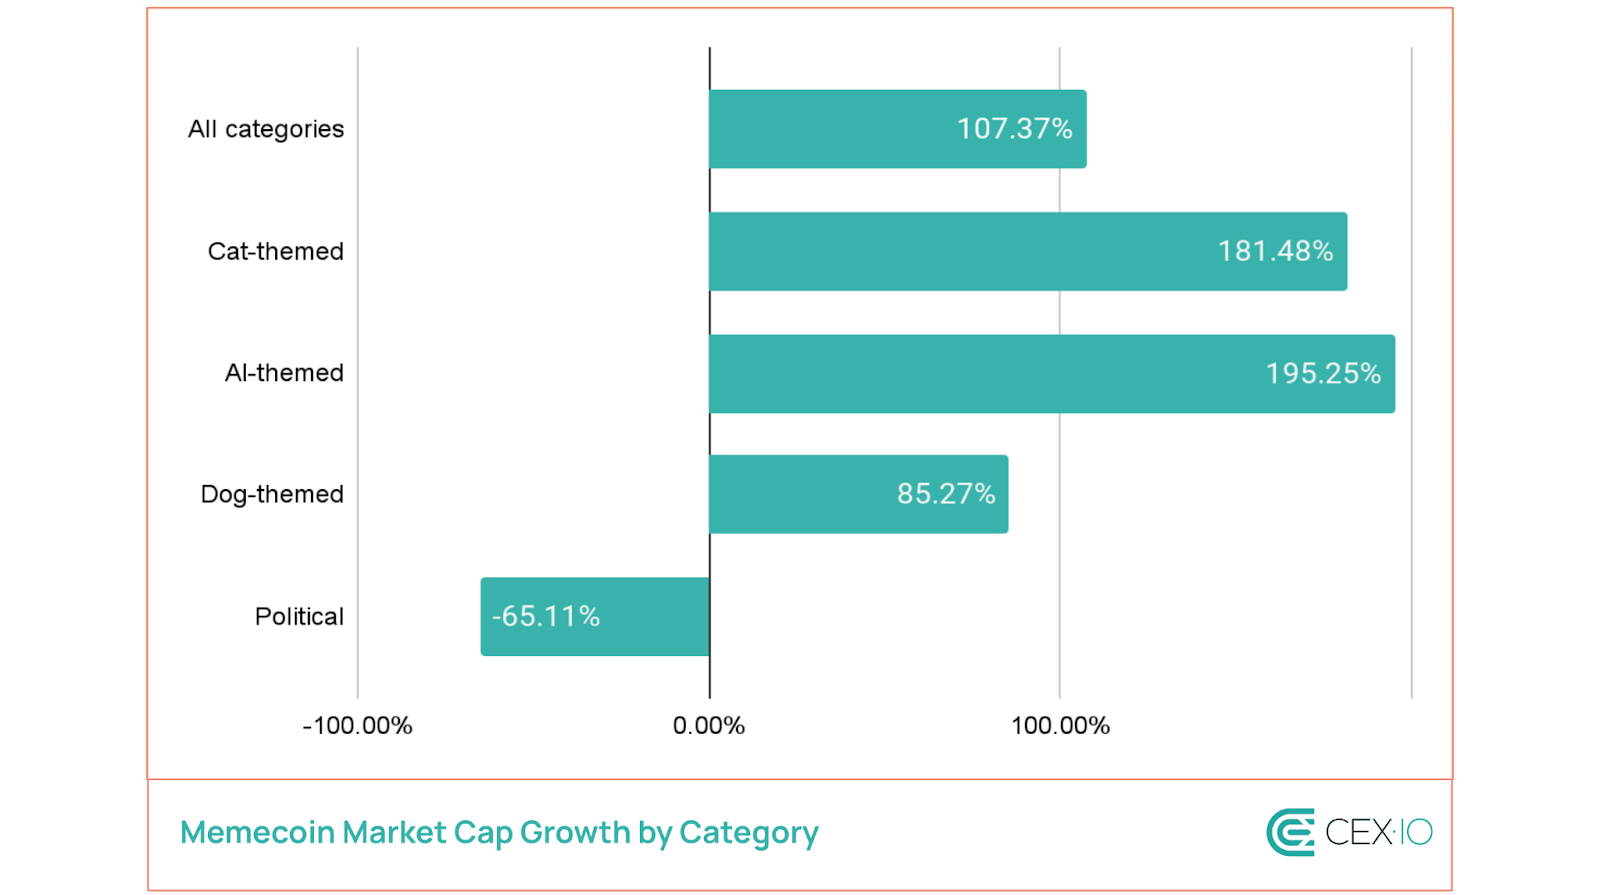
Broader memecoin zoo
One major driver that boosted memecoins’ influence in 2024 has been the growth of new communities. This led to the formation of different memecoin categories, which haven’t generally been a thing before March 2024. This is because the vast majority of the largest memecoins were dog-themed, representing around 85% of the sector’s market cap in early March. However, their share fell to 72% by November, with AI-related and cat-themed memecoins dominating in the market cap growth over the past six months. By December, their share in total memecoin market cap increased to 3.6% and 3.8%, respectively.
In terms of trading volume, dog-themed memecoins emerged as the fastest-growing category, with a 226% increase over the past six months. However, before the U.S. elections in November, political memecoins were taking the lead in trading volume growth. Following the event, most political memecoins saw a more than 80% drop in trading volume, losing market appeal.
Note: The performance from June 1, 2024, to December 1, 2024.
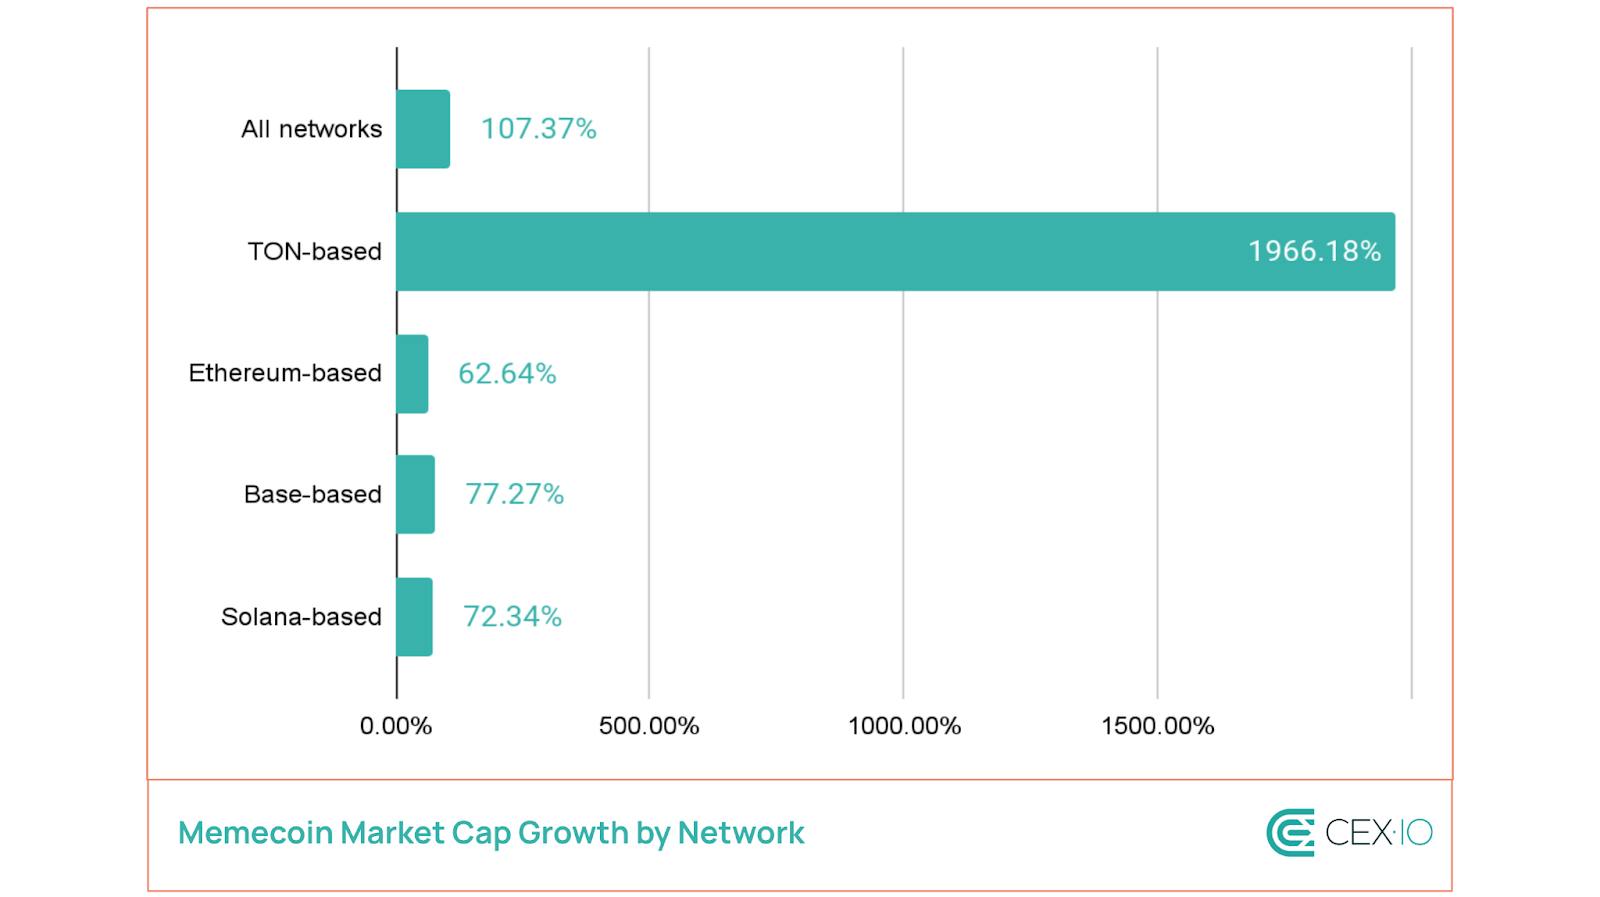
Moving outside Ethereum
In previous cycles, top-ranking memecoins primarily consisted of Dogecoin and a variety of Ethereum-based tokens. However, the 2024 memecoin boom extended to other networks, with Solana being the largest winner, currently accounting for 15% of market cap and 30% of trading volume within the sector.
Over the last six months, the largest growth in market cap has been observed in TON-based memecoins, with trading volume growing over 750 times, albeit still accounting for a minor share (1% and 2% in total memecoin market cap and volume, respectively).
Note: The performance from June 1, 2024, to December 1, 2024.
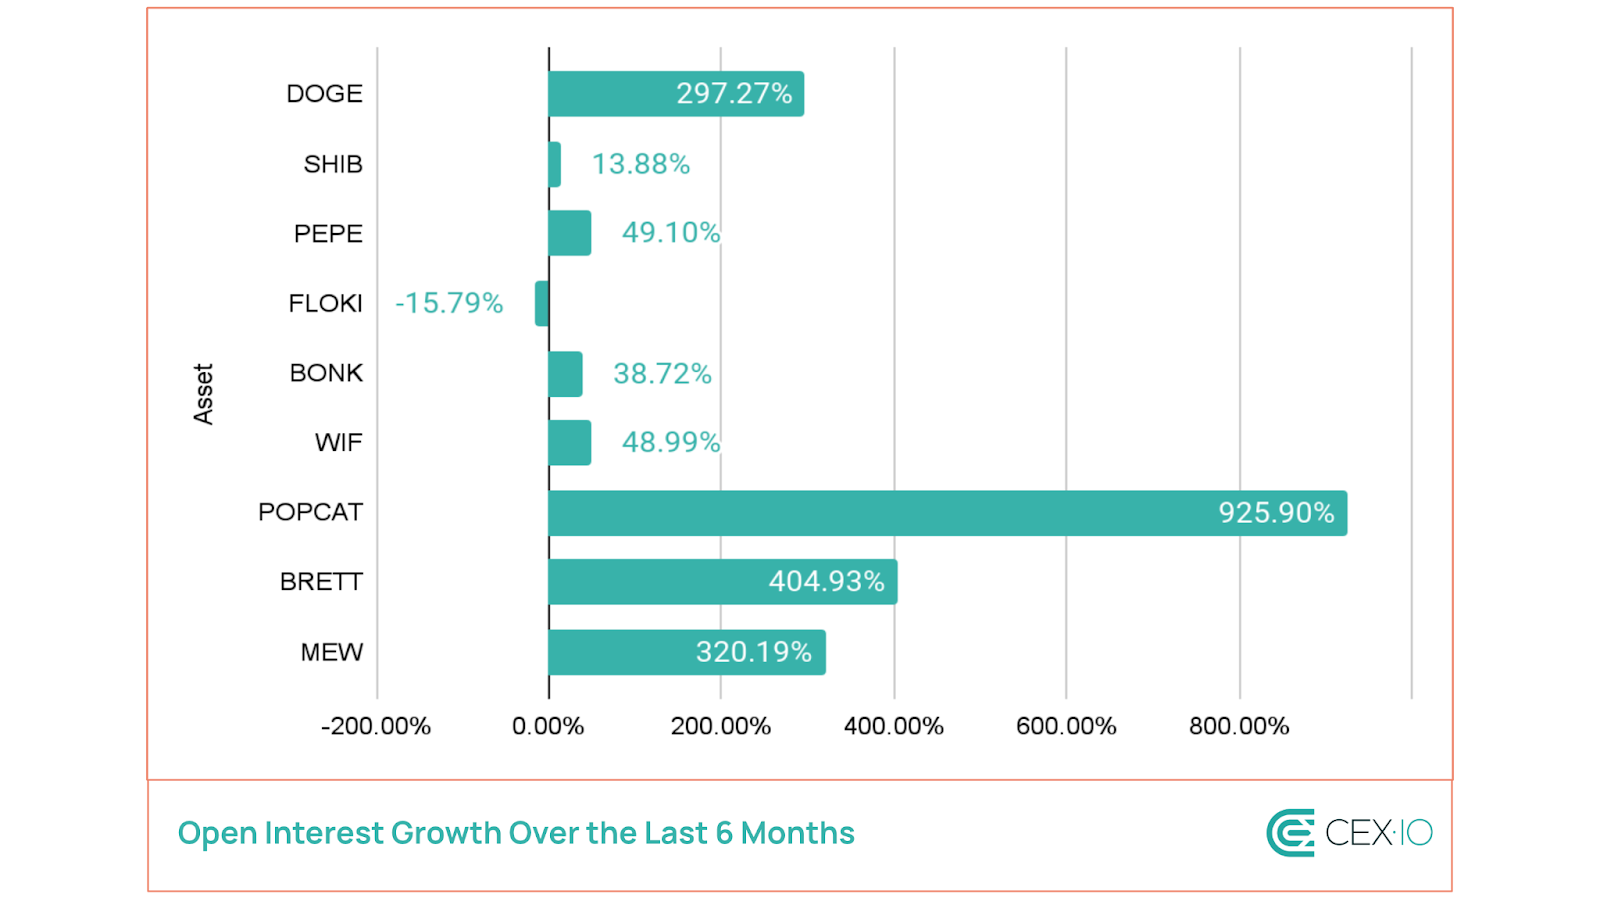
New Memecoins Lead in Futures Open Interest
At the start of 2024, most memecoin-related futures open interest was centered on Dogecoin, which held around 65% of the sector’s share. However, open interest later diversified to include newer memecoins, with WIF achieving a staggering 15,000% increase over 11 full months of 2024.
Following the March memecoin rally, market attention in futures shifted toward newly launched assets. Over the last six months, POPCAT, BRETT, and MEW have shown triple-digit growth in open interest, emerging as leading memecoins in the futures market. This growth reflects heightened investor speculation and volatility expectations, particularly among newer memecoins.
Note: The performance from June 1, 2024, to December 1, 2024.
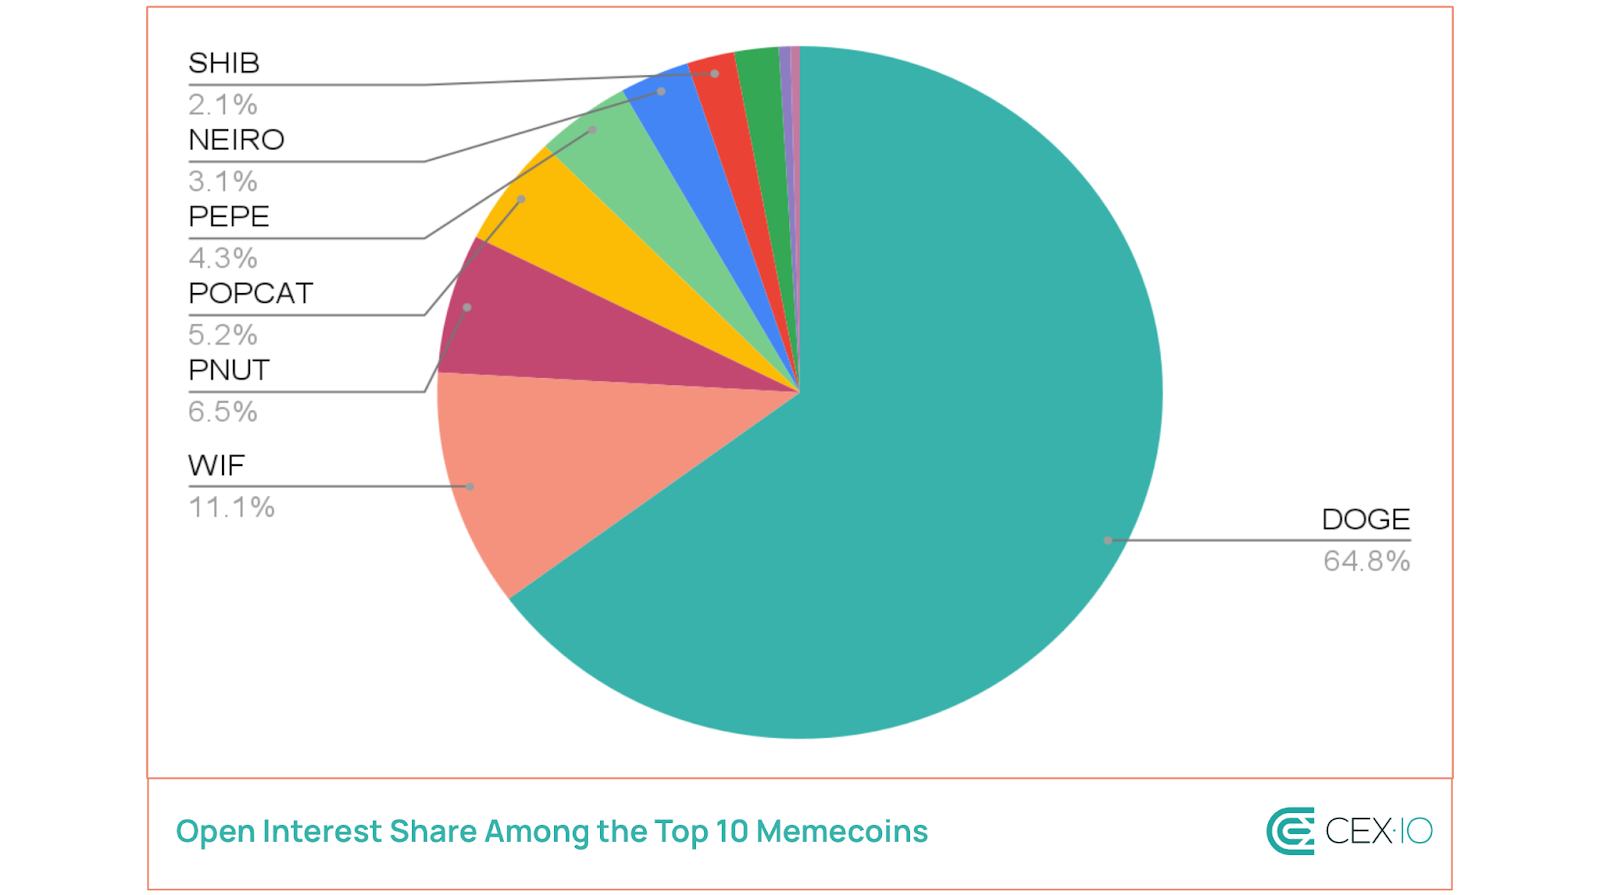
As a result, the memecoin sector turned into one of the fastest-growing in terms of crypto speculation, with the top 10 memecoins now accounting for more than 4% of total futures open interest.
By November, Dogecoin maintained its position as a leading memecoin in terms of open interest in the futures market, keeping its 65% share. However, this is primarily due to the creation of the Department of Government Efficiency (DOGE) following U.S. elections, which reestablished interest in the Dogecoin market. Before the news about the launch of this institution, Dogecoin’s share in memecoin open interest was around 51%.
Note: The share distribution as of December 1, 2024.
Part 3: Exploring Memecoin Amplifier During Market Volatility
Given memecoins’ rising share in the crypto market, we decided to analyze volatility events to gauge the sector’s sensitivity to market swings. We examined weeks with ±10% price changes for Bitcoin and Ether, using them as triggers for overall market movement. This analysis focused on the performance of the top six memecoins, which collectively accounted for over half of the sector’s market cap and trading volume in 2024. These assets include DOGE, SHIB, PEPE, FLOKI, WIF, and BONK.
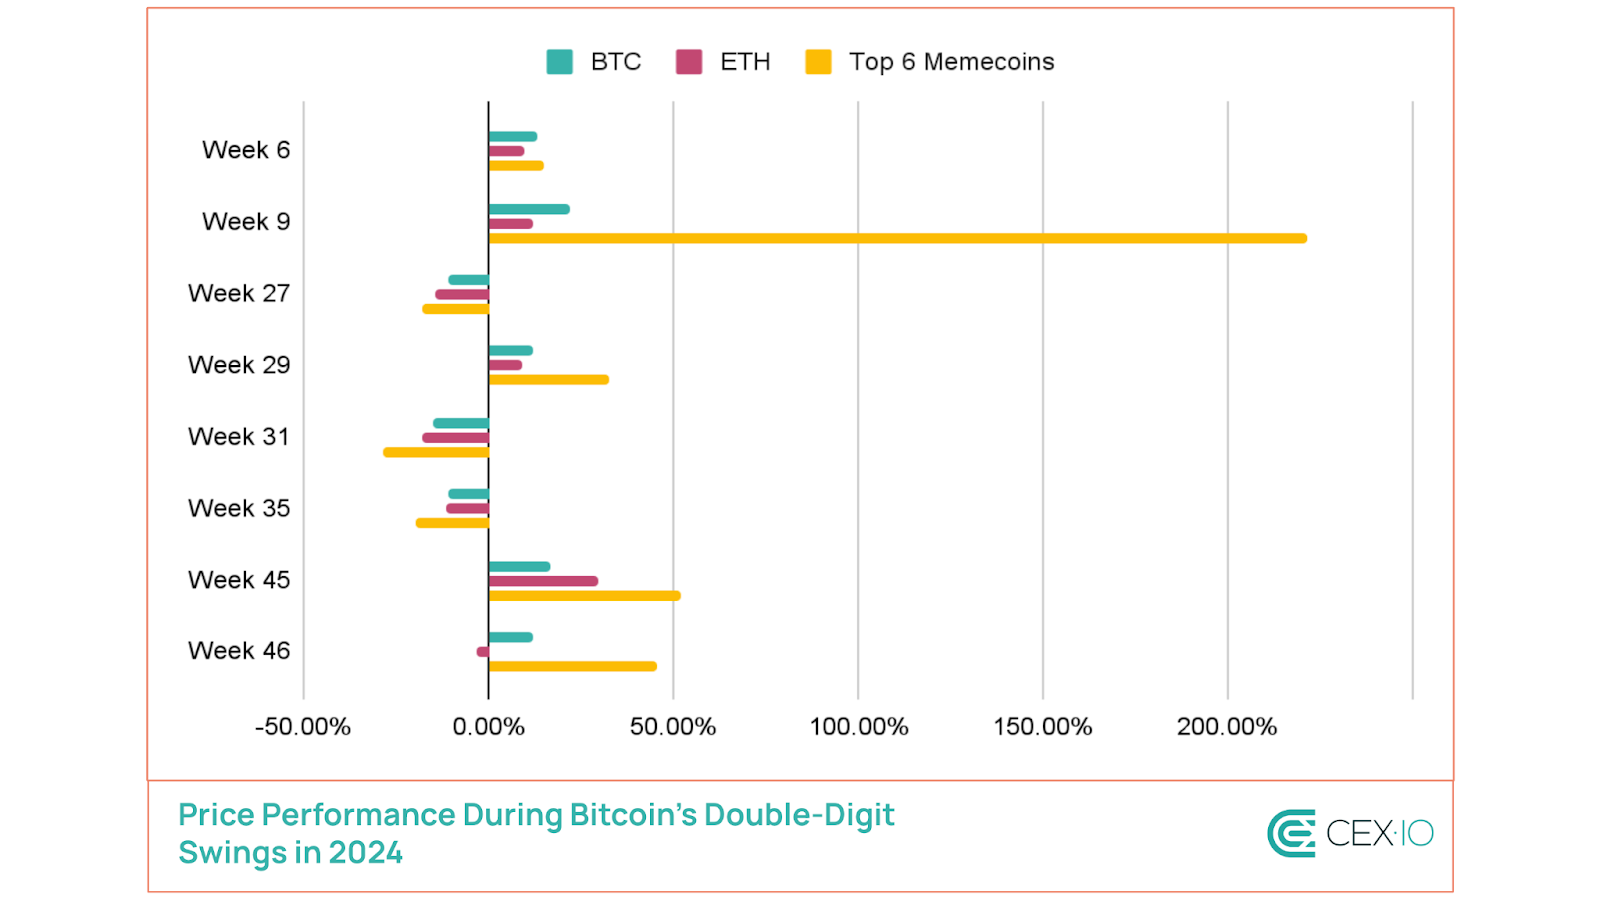
Key Insights: Bitcoin Volatility
Bitcoin saw 8 weeks of double-digit price changes in 2024, yielding the following insights:
Memecoins have outperformed Bitcoin during price surges, but suffered larger drops in downturns.
DOGE and BONK have shown the strongest correlation with Bitcoin, with an average sector correlation of 0.7.
The average “memecoin amplifier” effect was 2.89x (or 2.09x excluding a surge in early March). This means that for a 10% Bitcoin price change, memecoins exhibited average volatility of 28.9% and 20.9%, respectively.
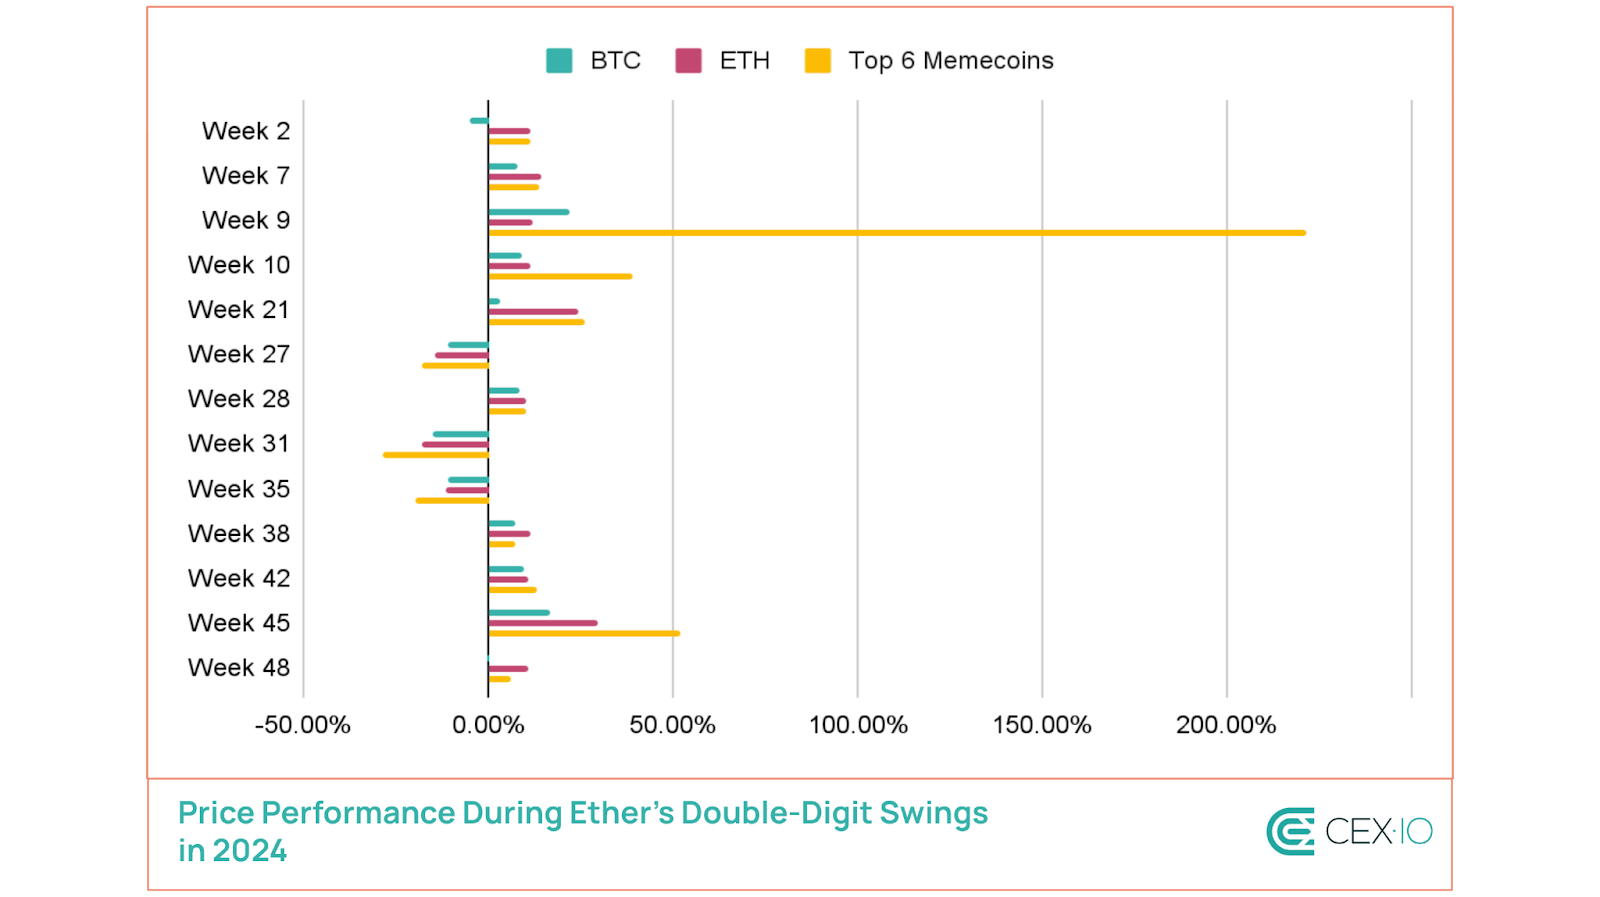
Key Insights: Ether Volatility
Ether’s 2024 volatility, with 13 weeks of double-digit price changes so far, suggested the following:
Memecoins had a higher average correlation with Bitcoin (0.74) during Ether’s fluctuations.
Memecoins underperformed Ether in more than half of the observed cases, suggesting Ether’s price changes have a limited impact on memecoin performance.
The average memecoin amplifier effect was 2.65x (1.35x excluding the Week 9 anomaly).
These price swings revealed that memecoins thrive more in Bitcoin-driven rallies than Ether ones. Furthermore, average memecoin amplifiers have been larger during BTC price surges than drops, even excluding the anomaly surge in early March.
Due to relatively high correlation and sensitivity to Bitcoin moves, the largest memecoins could potentially act as high-risk, high-reward proxy bets on Bitcoin. This is because Bitcoin serves as the primary driver of overall market sentiment, while top memecoins could be viewed as bets on this sentiment. Unlike Ethereum, which is heavily tied to utility-driven projects, Bitcoin’s simplicity as a store of value aligns more closely with the memecoin market’s speculative, hype-driven nature.
As a result, memecoins can amplify Bitcoin trading by acting as a gateway for retail investors who are looking for higher/faster returns during Bitcoin rallies. This influx can feed back into Bitcoin as traders rotate profits or losses between memecoins and Bitcoin, intensifying both trading volume and volatility.
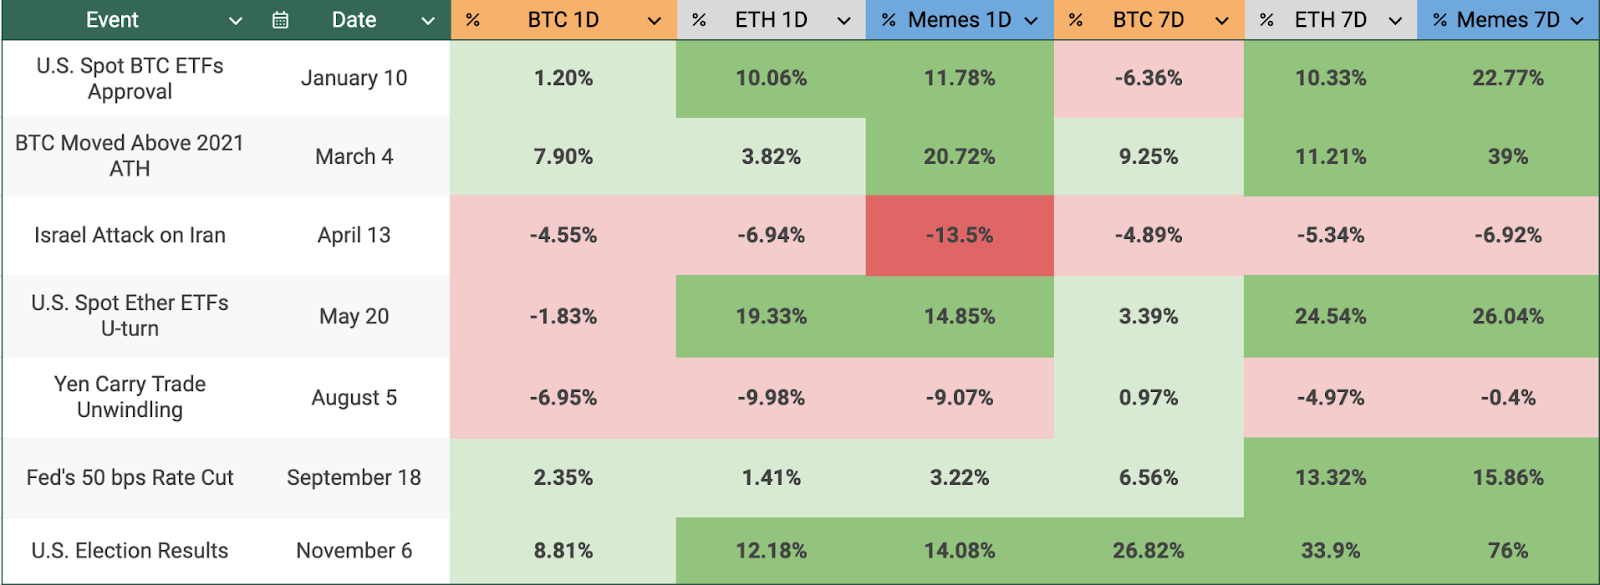
Memecoin Performance During High-Impact Events
Memecoins have also been more sensitive to high-impact events, often reacting with amplified moves, surpassing both BTC and ETH in either direction. Within a week, memecoin response typically accelerates if there is a broader crypto market rally, or smooths out depending on the performance of top digital assets. For example, during the Yen carry trade unwinding in early August, top memecoins nearly offset losses as Bitcoin quickly rebounded.
Table: Digital asset price performance amid major 2024 events. Note: “Memes” performance includes the average price change of the top 6 memecoins over 1-day and 7-day periods.
Conclusion
Memecoins are no longer a joke — their market share in crypto has surged by 2-4 times over the first 10 months of 2024. In November, the influence of memecoins expanded even further, experiencing a new hype wave. Moreover, this may be just the beginning. Bitcoin’s dominance has been predominantly on the rise throughout this year, with only three brief altcoin seasons so far. In previous cycles, post-halving rallies have coincided with declining Bitcoin dominance and extended altcoin seasons. Consequently, the next 6-12 months could see memecoins flourish even more, potentially establishing a solid sentiment indicator for the entire industry.
The web content provided by CEX.IO is for educational purposes only. The information and tools provided neither are, nor should be construed as, an offer, or a solicitation of an offer, or a recommendation, to buy, sell or hold any digital asset or to open a particular account or engage in any specific investment strategy. Digital asset markets are highly volatile and can lead to loss of funds. The availability of the products, features, and services on the CEX.IO platform is subject to jurisdictional limitations. To understand what products and services are available in your region, please see our list of supported countries and territories. This page includes additional links to information about individual products, and their accessibility.
The 1.75 million BTC decrease in LTH supply in 2024 indicates that there is still ample room for LTH selling pressure.
U.S. spot ETFs absorbed 2.4x the annual mining supply in 2024, but their trading volume represents less than 4% of the market.
MicroStrategy’s Bitcoin accumulation exceeded half the scale of net ETF inflows.
Exchange reserves dropped by 21%, while OTC balance increased by 105%, hinting at supply redistribution.
Around 40% of Bitcoin’s transaction volume in 2024 was linked to exchanges.
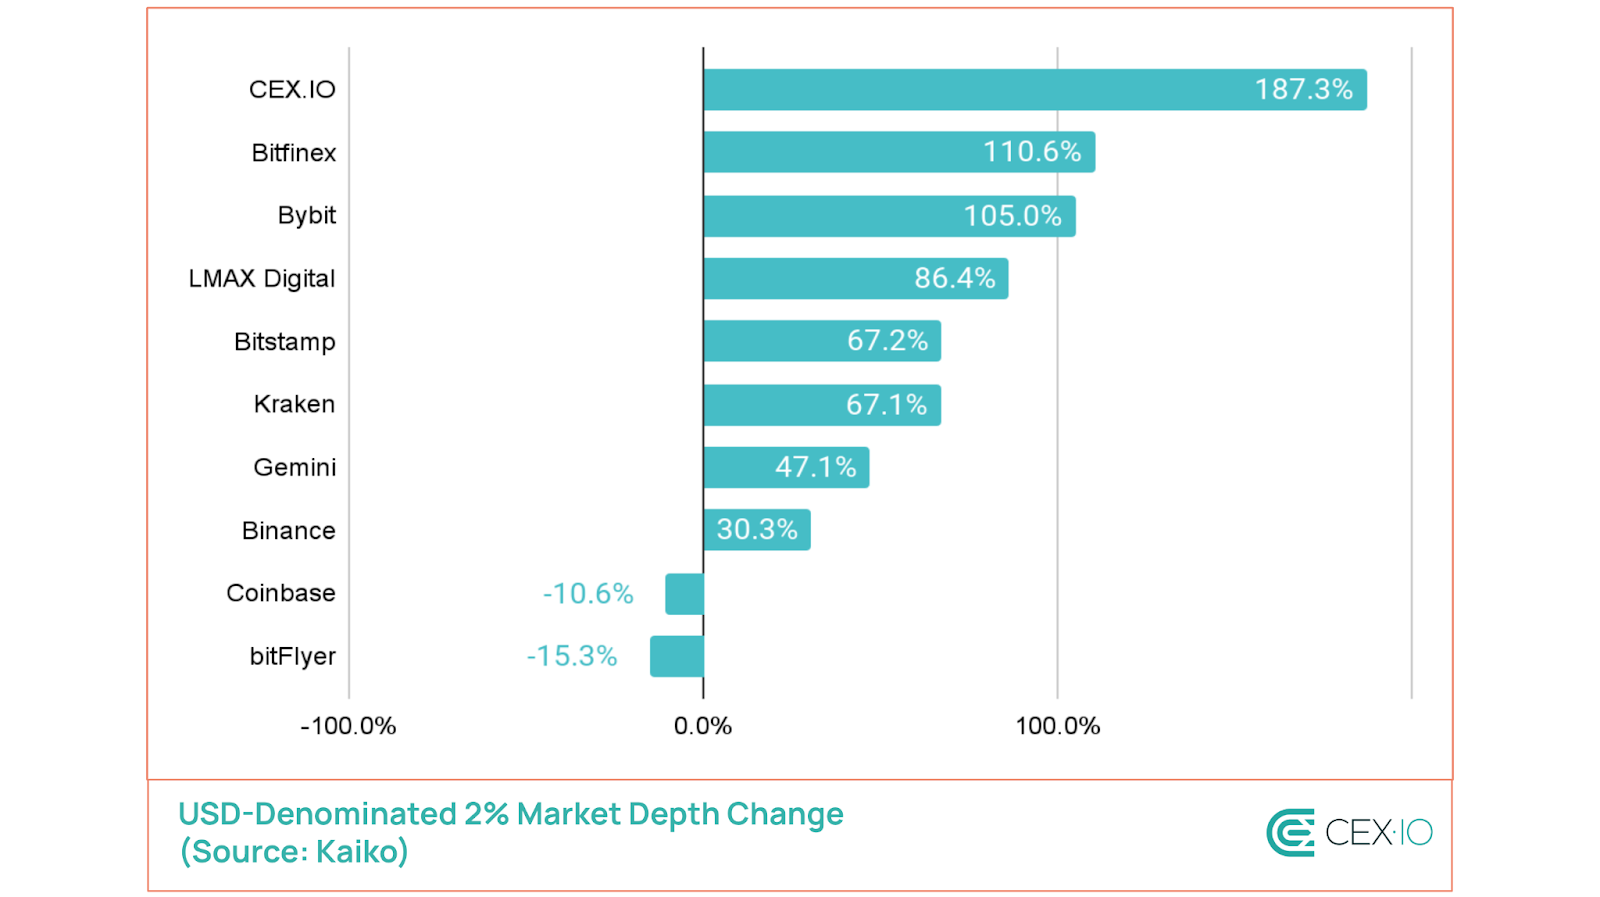
Bitcoin’s USD-denominated 2% market depth increased by 61%, suggesting an improved liquidity landscape.
CEX.IO quadrupled its market share in 2024, becoming a top 2 exchange in terms of Bitcoin market depth.
Introduction
Bitcoin demonstrated remarkable performance in 2024, recording a more than 121% price increase and registering rising market dominance. The major catalyst behind this move was a supply-and-demand rebalance due to Bitcoin’s halving and the introduction of U.S. spot Bitcoin ETFs.
With Bitcoin’s continued expansion into traditional finance and the anticipation of a potential U.S. Bitcoin strategic reserve, some speculate that Bitcoin could face a significant supply shock in this cycle. These predictions even suggest Bitcoin could challenge the 4-year cycle theory, with its price growing at an unprecedentedpace. While such claims arise every cycle, we decided to evaluate Bitcoin’s supply and liquidity landscape to understand its potential risks and opportunities.
Methodology
Our research employed the following resources to provide a holistic view of Bitcoin’s supply and liquidity:
Kaiko: To analyze aggregated market depth data and liquidity trends across over 30 major exchanges.
CryptoQuant: To track flows between crypto platforms, including deposits and withdrawals, and their implications for market sentiment.
Checkonchain: To assess supply dynamics and on-chain wallet behavior.
Velo: To analyze cash-and-carry trade efficiency on the Bitcoin ETF market.
Long-Term Holder Supply Developments
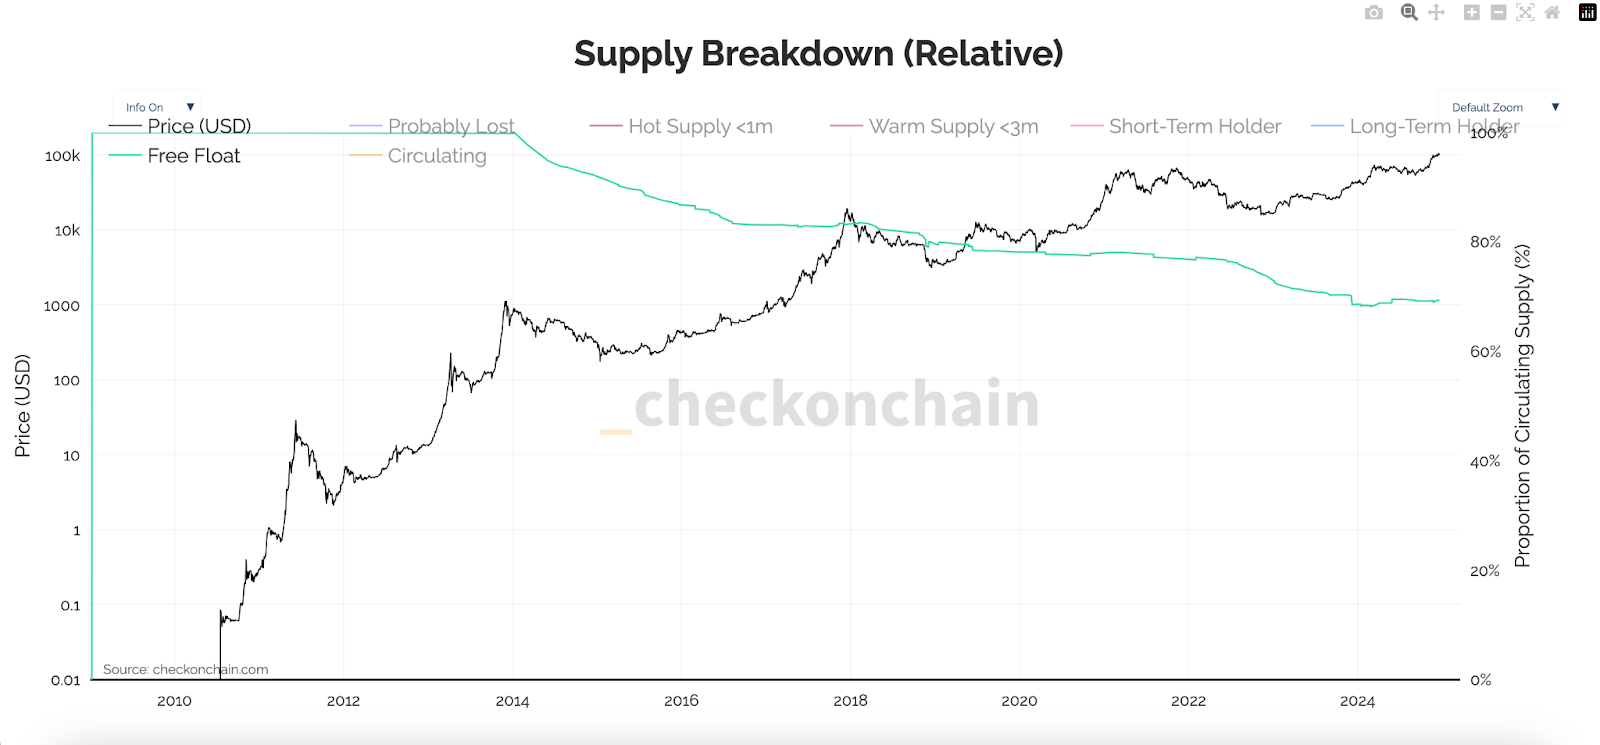
Free Float
By assessing the free float supply — the portion of coins potentially available for trading if their owners choose to sell — a clear decreasing trend emerges across cycles. This suggests that an increasing amount of Bitcoin becomes inactive, as more users HODL their coins for extended periods or probably lose access to their wallets, leading to concerns about a potential supply shock. However, the free float supply still represents 70% of the circulating supply, or over 13.76 million BTC, offering a massive potential to enhance existing Bitcoin liquidity.
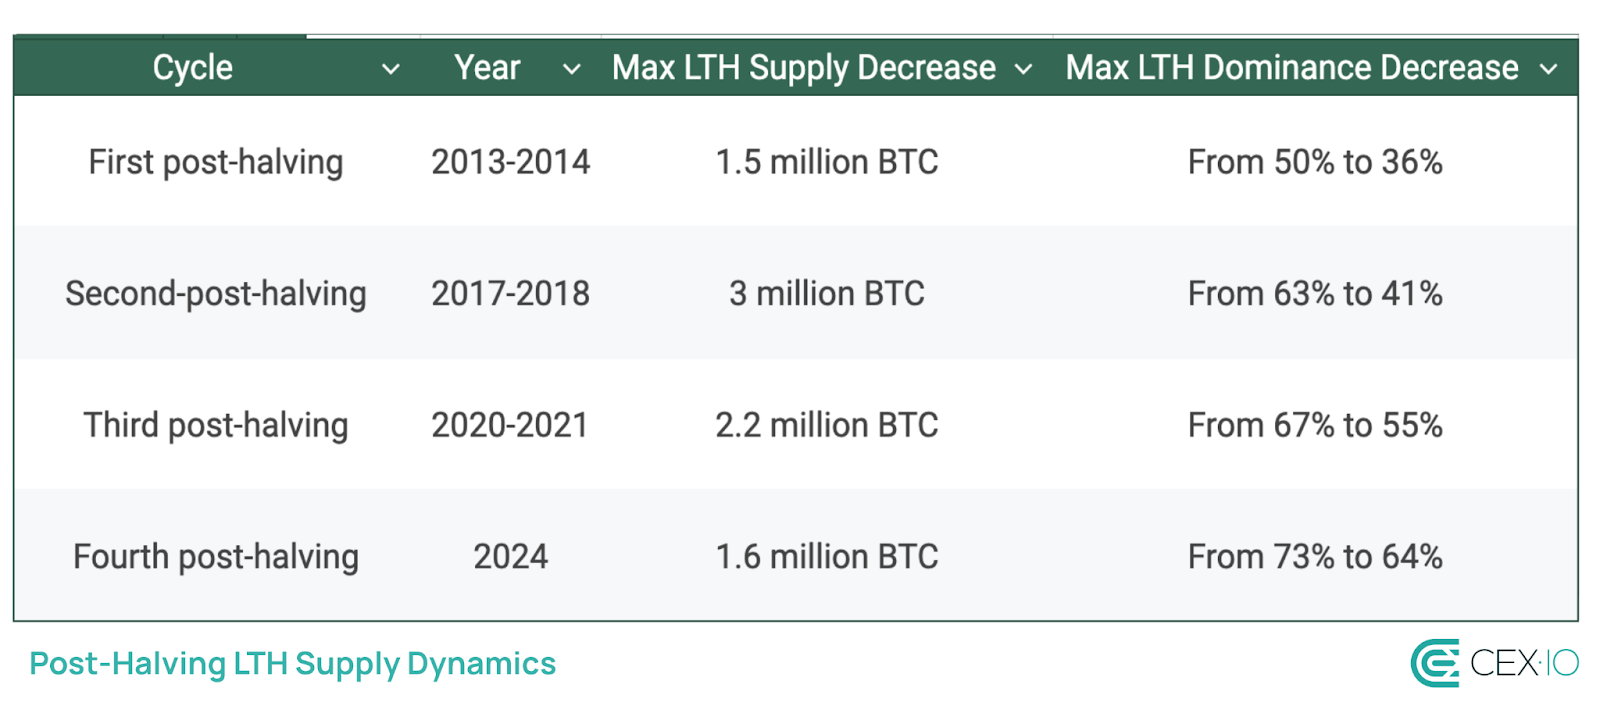
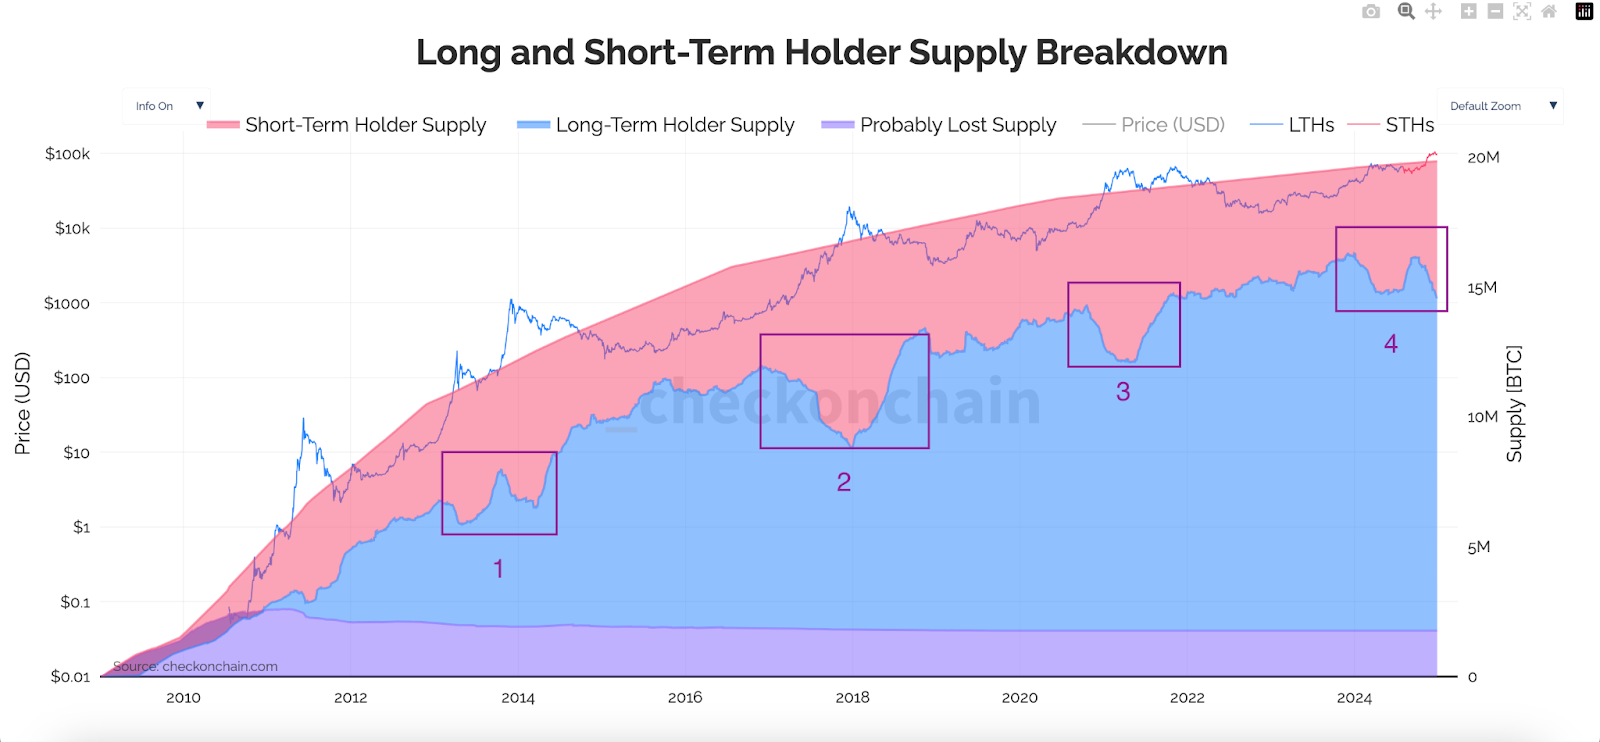
Post-Halving Behavior
The decrease in free float supply is partly associated with long-term holder (LTH) supply, whose dominance increases with consecutive cycles. However, a notable portion of LTH supply becomes active post-halving, causing a briefly increased transition of coins to short-term holders (STH). Historically, such periods of decreased LTH dominance coincided with bull runs, heightened trading volumes, and improved market liquidity.
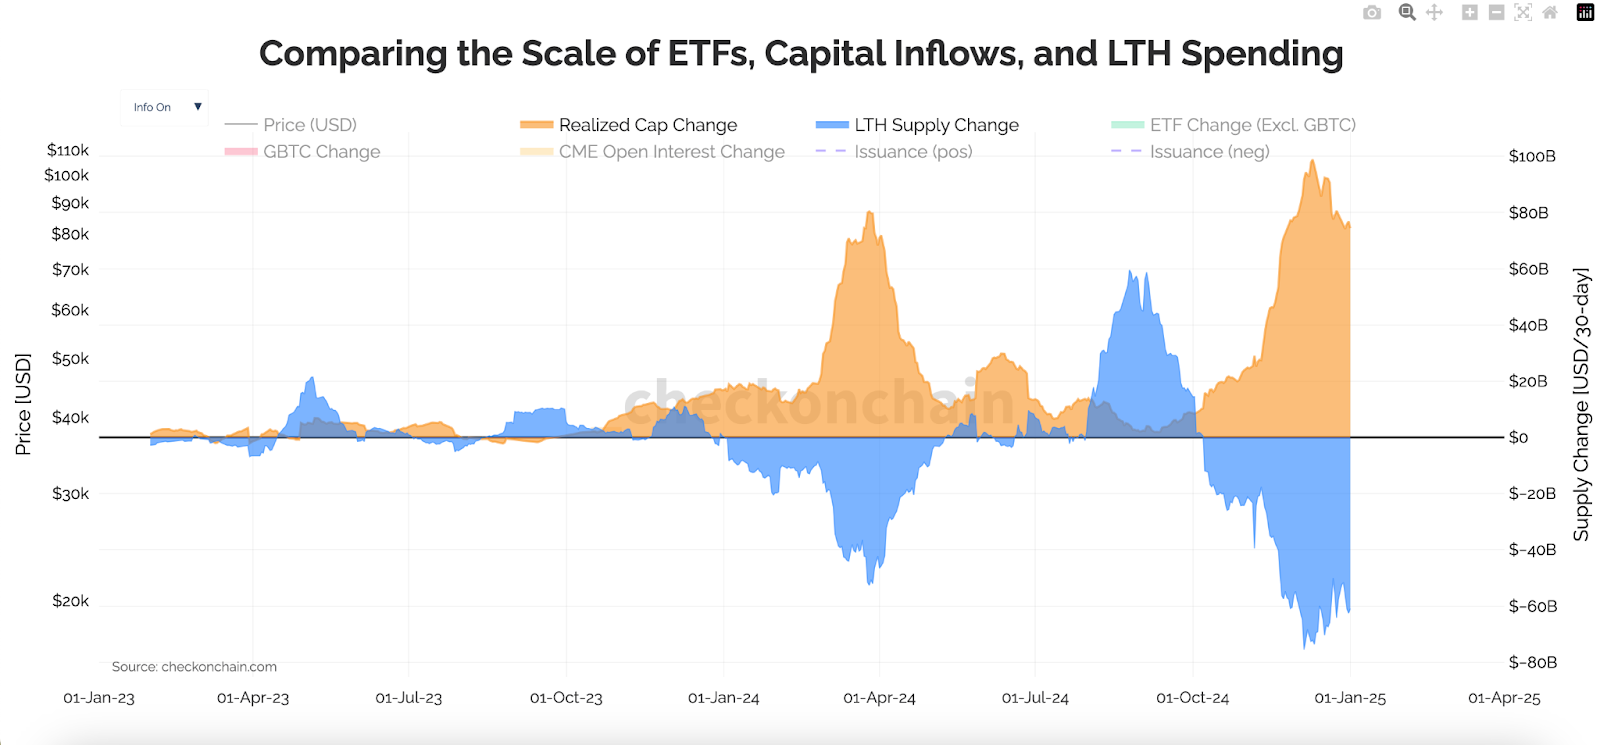
In 2024, the LTH supply decreased by over 1.75 million BTC, now representing 64.4% of the circulating supply. A distinctive feature of this cycle was a sharp dip in LTH supply shortly before the halving, driven by Bitcoin’s unprecedented breakout to a new all-time high. While this decline had stabilized by September, a renewed LTH supply drop emerged in Q4, totaling 1.58 million BTC.
On average, the LTH supply has been losing around 16% in dominance during post-halving rallies. Considering the existing 9% post-halving decline in dominance, there is still ample room for LTH selling pressure in this cycle, which will likely be absorbed by newly joined market participants.
Note: Numbers represent the post-halving period highlighted in the table above.
Most of the LTH selling pressure typically occurs during periods of significant increases in the realized cap. For example, in Q1 2024, a surge of up to $80 billion in the realized cap coincided with a $50 billion decline in LTH supply. This trend escalated in Q4, driving over $75 billion in LTH selling activity alongside a $90 billion increase in the realized cap. Such market behavior serves as a natural counterbalance to Bitcoin rallies, tempering upward momentum and contributing to the formation of local peaks, including 4-year cycle highs.
Looking into 2025
Any potential increase in demand from institutional investors and/or governments in 2025 will likely be met with a considerable increase in LTH profit-taking, pushing the LTH supply lower this year. Taking into account an average decline in LTH supply dominance during post-halving rallies, 1.4 million BTC could be potentially transferred from LTH to STH hands within 2025 bull run, enhancing market liquidity and mitigating the risks of a potential supply shock in this cycle.
ETF Market Dynamics
Rapid Adoption with Exaggerated Narratives
U.S. spot Bitcoin ETFs proved highly successful, accumulating around 500,000 BTC in 2024, and now collectively holding over 1.13 million BTC, or roughly 5.7% of Bitcoin’s circulating supply. This rapid adoption, bolstered by widespread reporting in both mainstream and industry media, raised concerns about a potentialsupplyshock caused by ETFs. In most cases, these narratives compare ETF flows to the newly mined Bitcoin supply, particularly during days of significant inflows. However, a broader perspective reveals that while ETFs are influential, their impact may not be as substantial as often perceived.
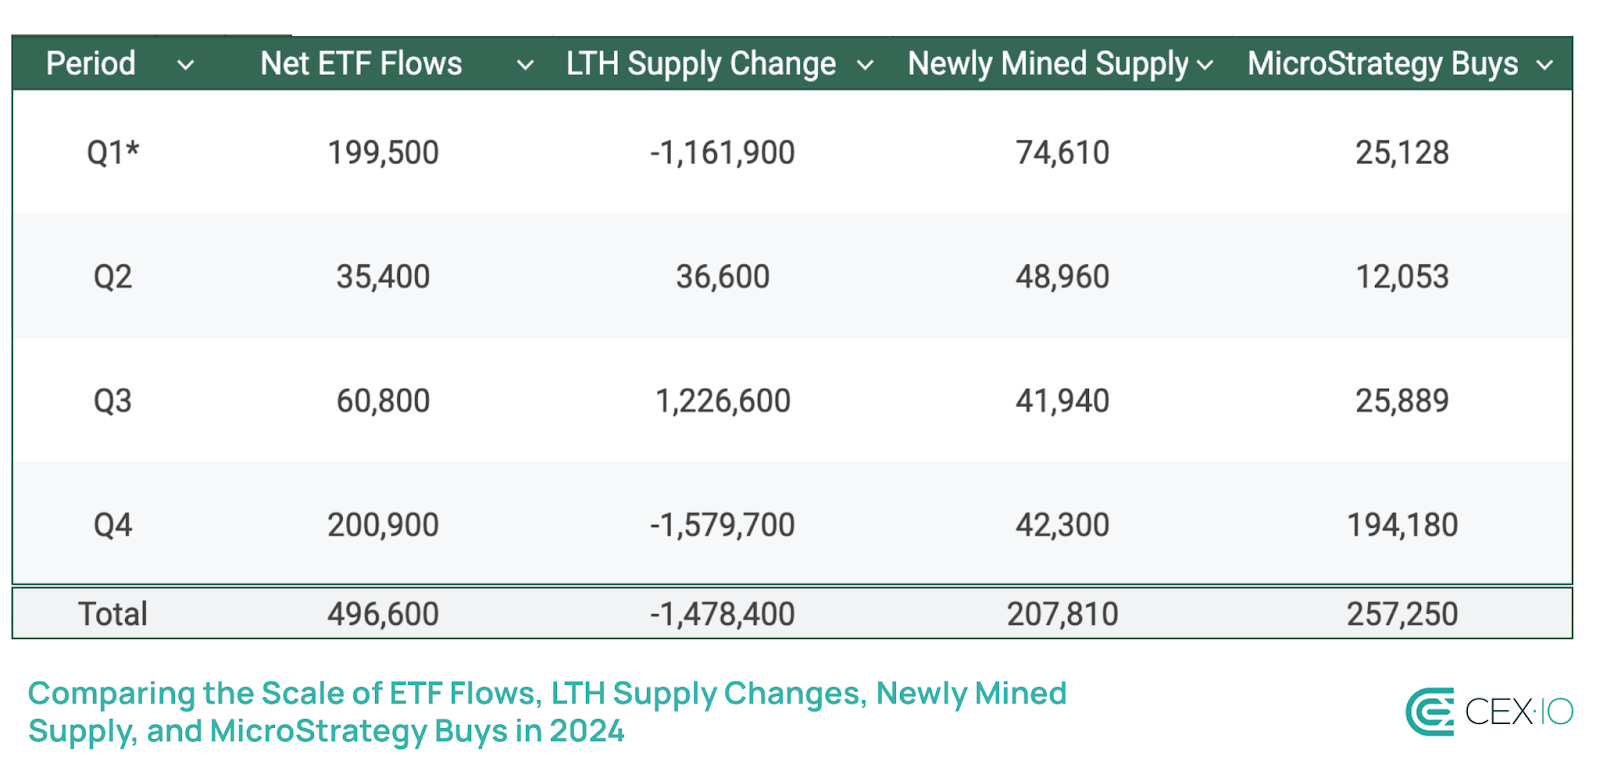
*Q1 performance includes data starting from January 11, 2024, when U.S. spot Bitcoin ETFs began available for trading. The data points are reflected in the amount of BTC over the selected period.
In 2024, net ETF flows outpaced the newly mined Bitcoin supply by approximately 2.4 times. Despite this outperformance, the trend has not been consistent. Notably, net ETF inflows lagged in Q2, even as the Bitcoin halving event significantly reduced the newly mined supply.
If compared to LTH supply dynamics, the weight of ETFs is falling even further. ETFs absorbed at most 35% of LTH supply, primarily in Q1 and Q4. This indicates that other factors, such as direct institutional buying or other non-ETF inflows, potentially played a more significant role in offsetting selling pressure directly. One notable factor has been MicroStrategy, which accumulated over 257,000 BTC in 2024 — an amount exceeding half the scale of net ETF inflows. It is worth noting, however, that MicroStrategy employs a TWAP strategy to minimize its market impact during Bitcoin purchases, meaning their accumulation has had a more subdued influence on price volatility compared to immediate large-volume trades.
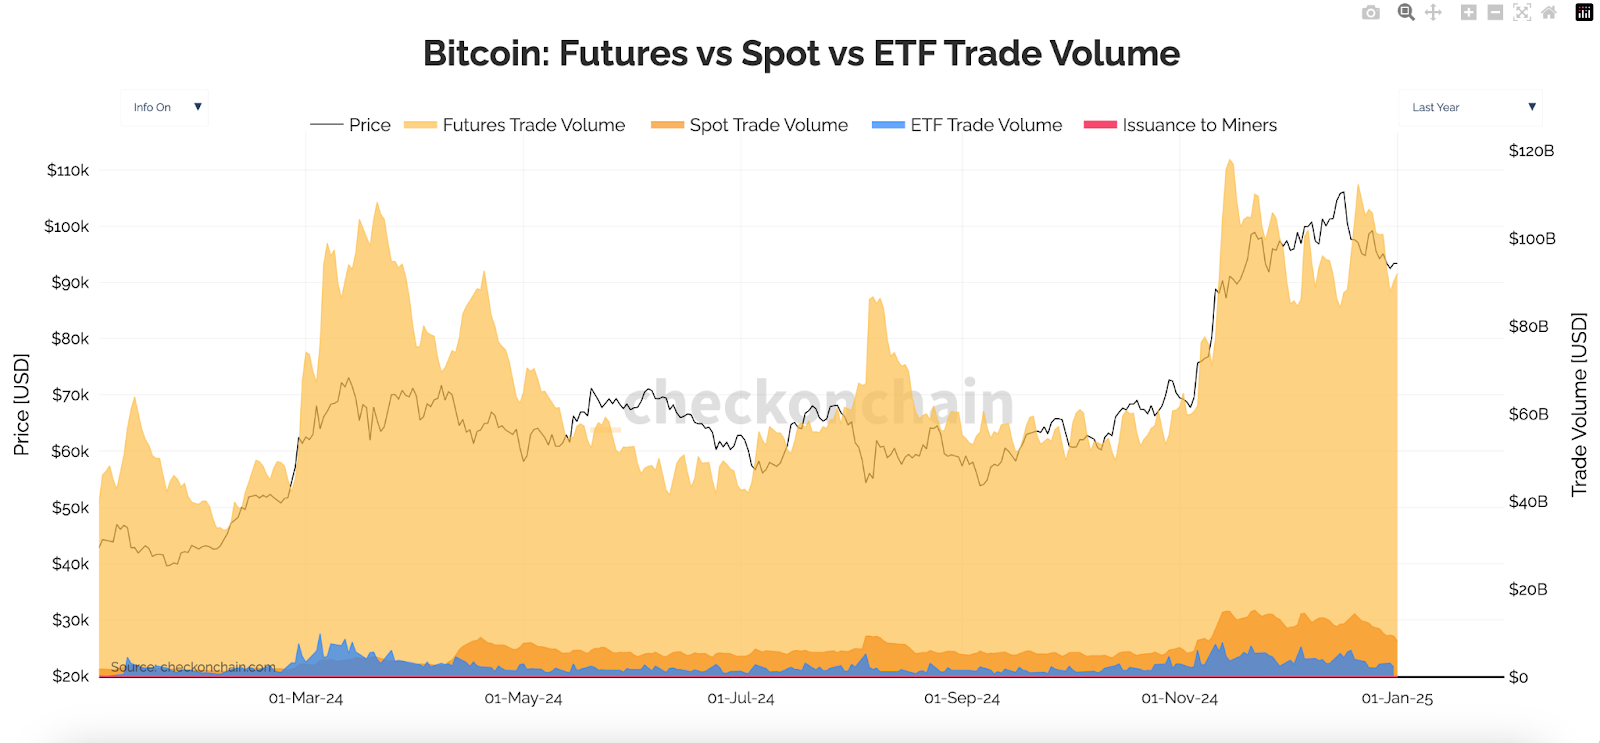
In addition, ETFs currently account for less than 4% of Bitcoin’s total trading volume. Although Q1 saw ETFs’ volume briefly surpass spot market volume, they now contribute about half of it.
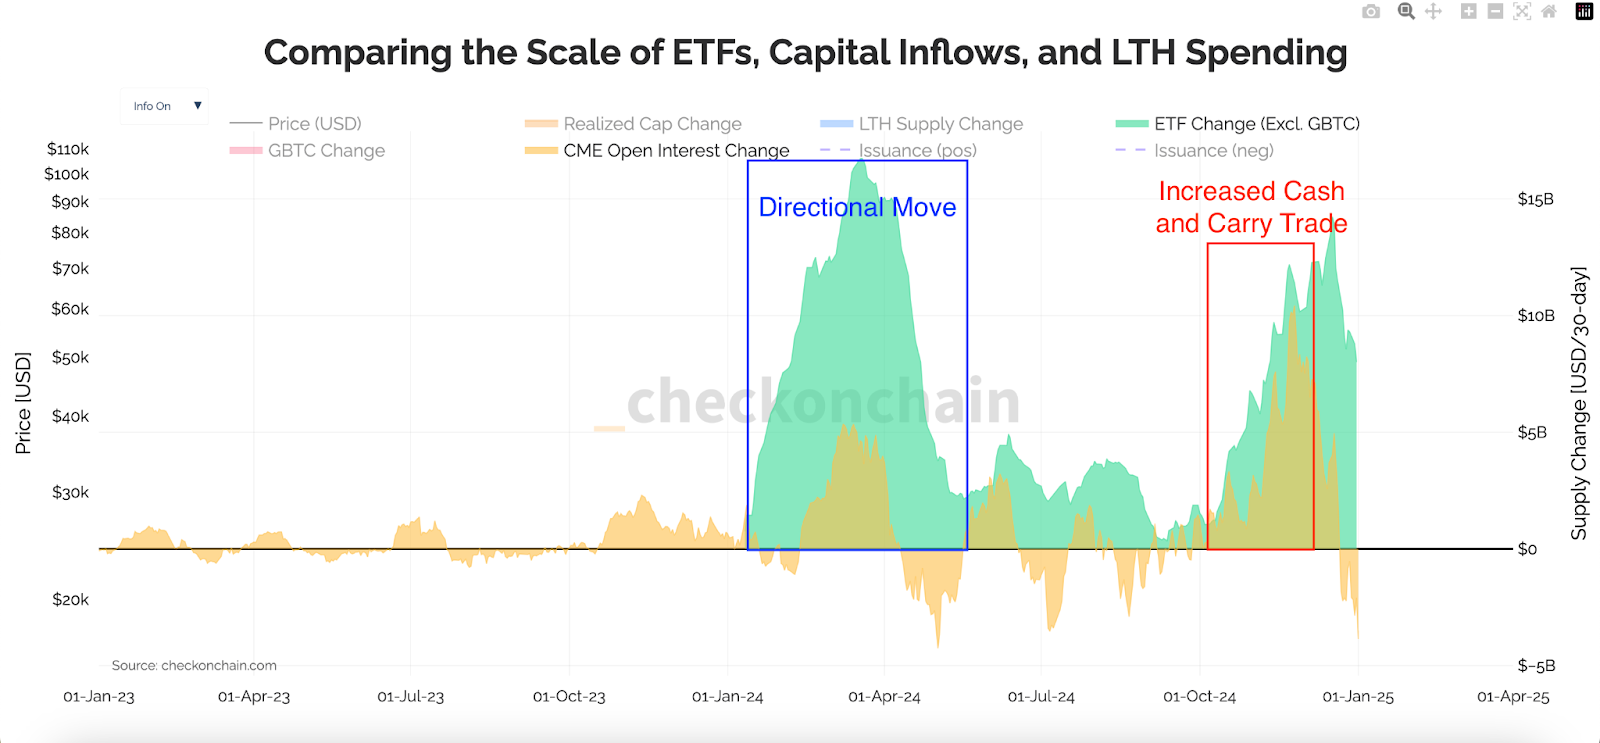
Impact of Cash-and-Carry Trade
A substantial portion of ETF inflows in 2024 was driven by the cash-and-carry trade, not only directional investment. This arbitrage strategy involves buying ETFs while shorting Bitcoin futures, capturing the premium between the spot/ETF and futures prices. Since this is a market-neutral trade, which balances supply and demand, it does not exert directional pressure on Bitcoin prices.
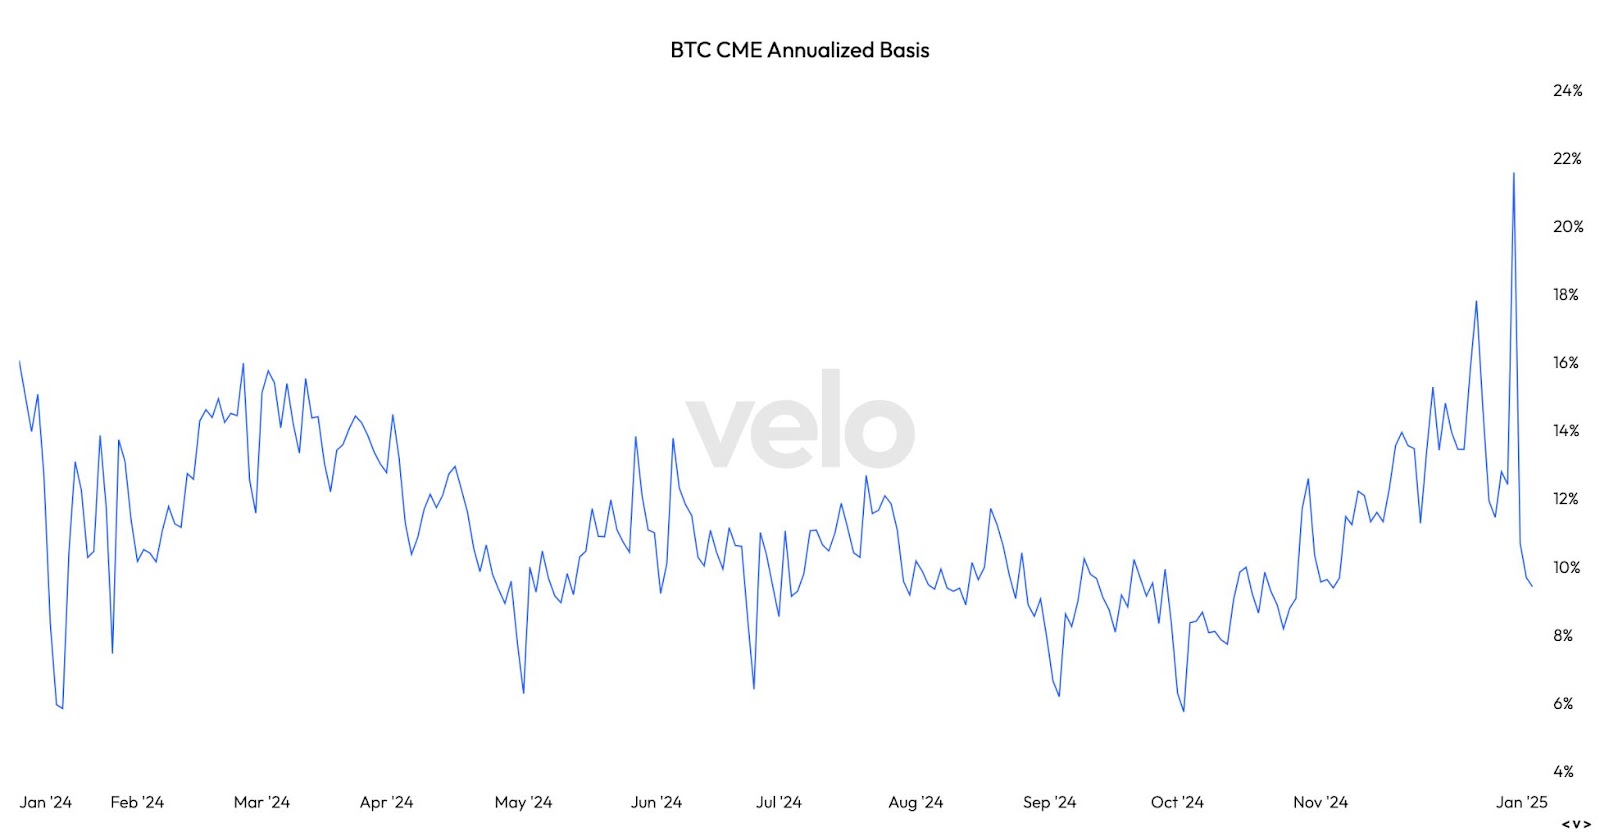
In 2024, cash-and-carry trade related to Bitcoin ETFs was typically executed using short positions on CME Bitcoin futures. According to Velo data, the annualized three-month basis in CME’s BTC futures has primarily been in the 5-15% range over the past year. In other words, setting up a cash-and-carry trade would earn investors 5-15%.
Although 5-15% might not sound like much compared to Bitcoin’s 121% annual growth, it was enough to take advantage of this market inefficiency. By comparing the scale of ETF inflows and CME open interest, it can be seen that ETF activity in Q1 2024 was more directional, reflecting increased interest in Bitcoin exposure. Post-election, the market primarily shifted towards cash-and-carry trades, while in December, directional activity resurged, signaling renewed investor interest in outright Bitcoin exposure.
Looking into 2025
The recent introduction of ETF options could transform cash-and-carry trades in 2025 by offering a more flexible and precise hedging mechanism. While CME futures have traditionally been used for such strategies, ETF options provide an alternative that may reduce reliance on futures. This shift could also mitigate the risk of a Bitcoin supply shock, as these trades utilize derivatives without directly impacting the spot supply.
In this case, ETF flows would appear more like directional investments and may even ramp up, especially as Bitcoin’s post-halving rally seems far from conclusion. However, considering the existing pace, ETF-related activity currently appears insufficient to drive a potential supply shock and rather offsets the decline in native retail activity.
Reserves on Trading Platforms
Exchanges
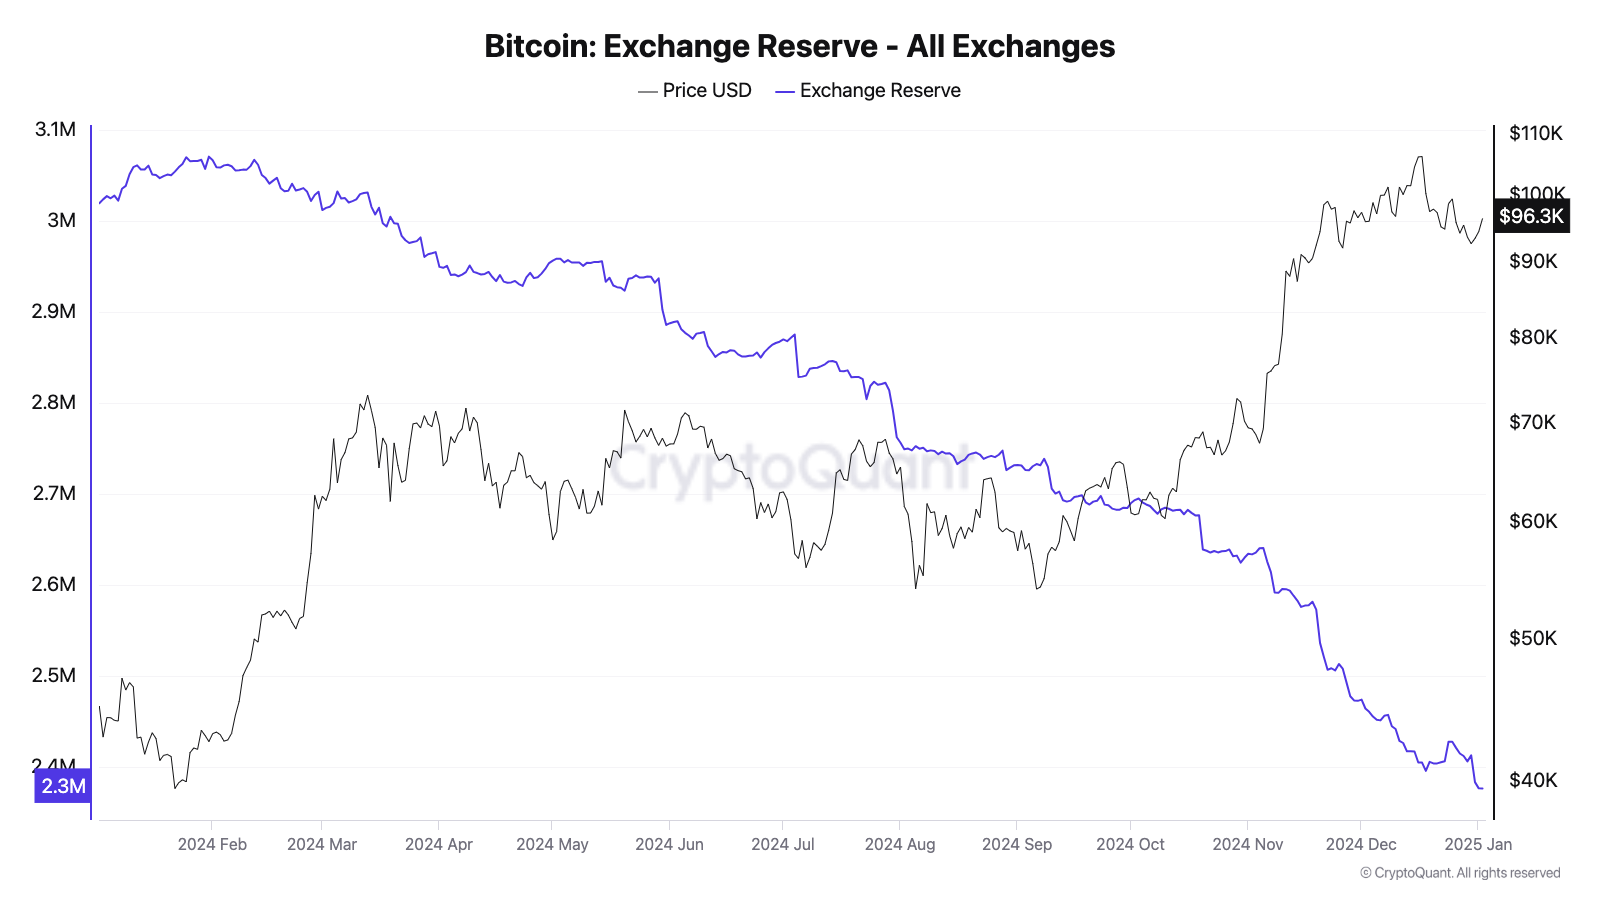
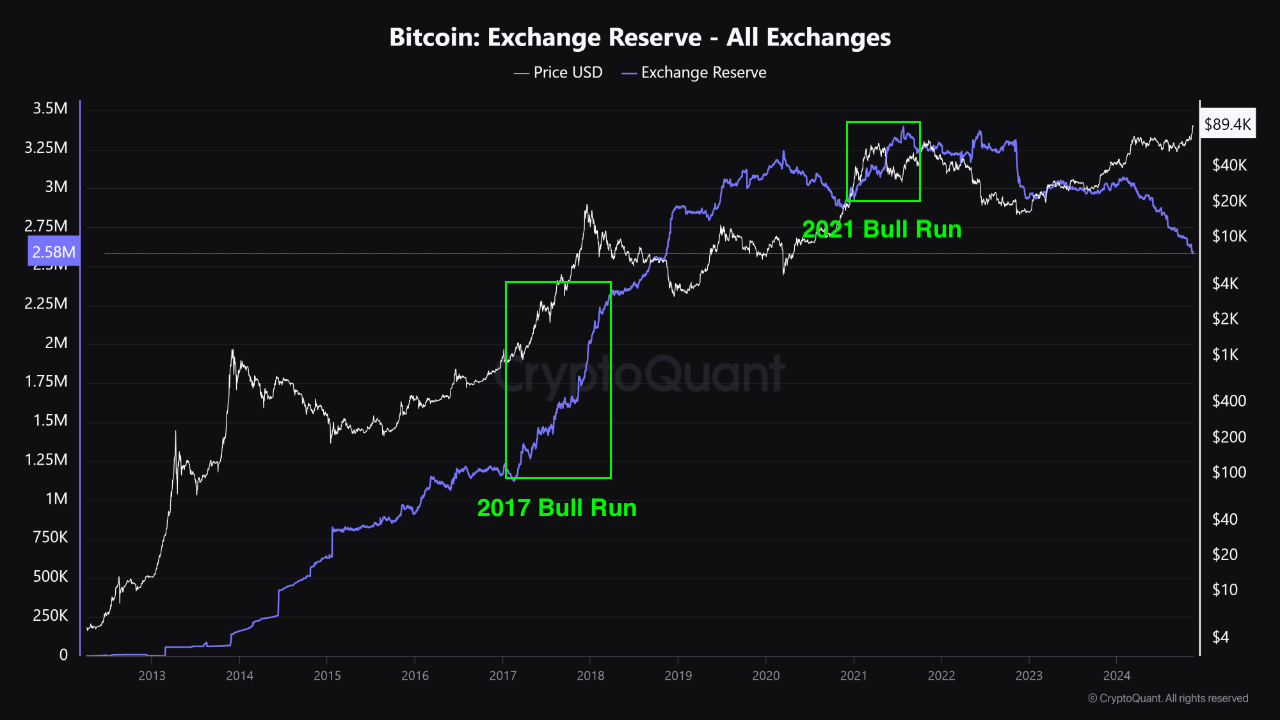
Another popular supply shock indicator is the amount of Bitcoin stored on exchanges and over-the-counter (OTC) platforms, with some observers pointingout that existing reserves are at record low levels. As such, Bitcoin’s exchange reserves experienced a sharp 21% decline in 2024, reaching levels not seen since 2018, according to CryptoQuant. Over 600,000 BTC were withdrawn from major exchanges, with around 40% of these withdrawals occurring after the U.S. elections.
Spot-focused exchanges were the hardest hit, seeing a 31% reduction in their Bitcoin holdings. In contrast, derivatives-oriented platforms fared slightly better, with a 13% decline, most of which occurred in the final quarter of the year.
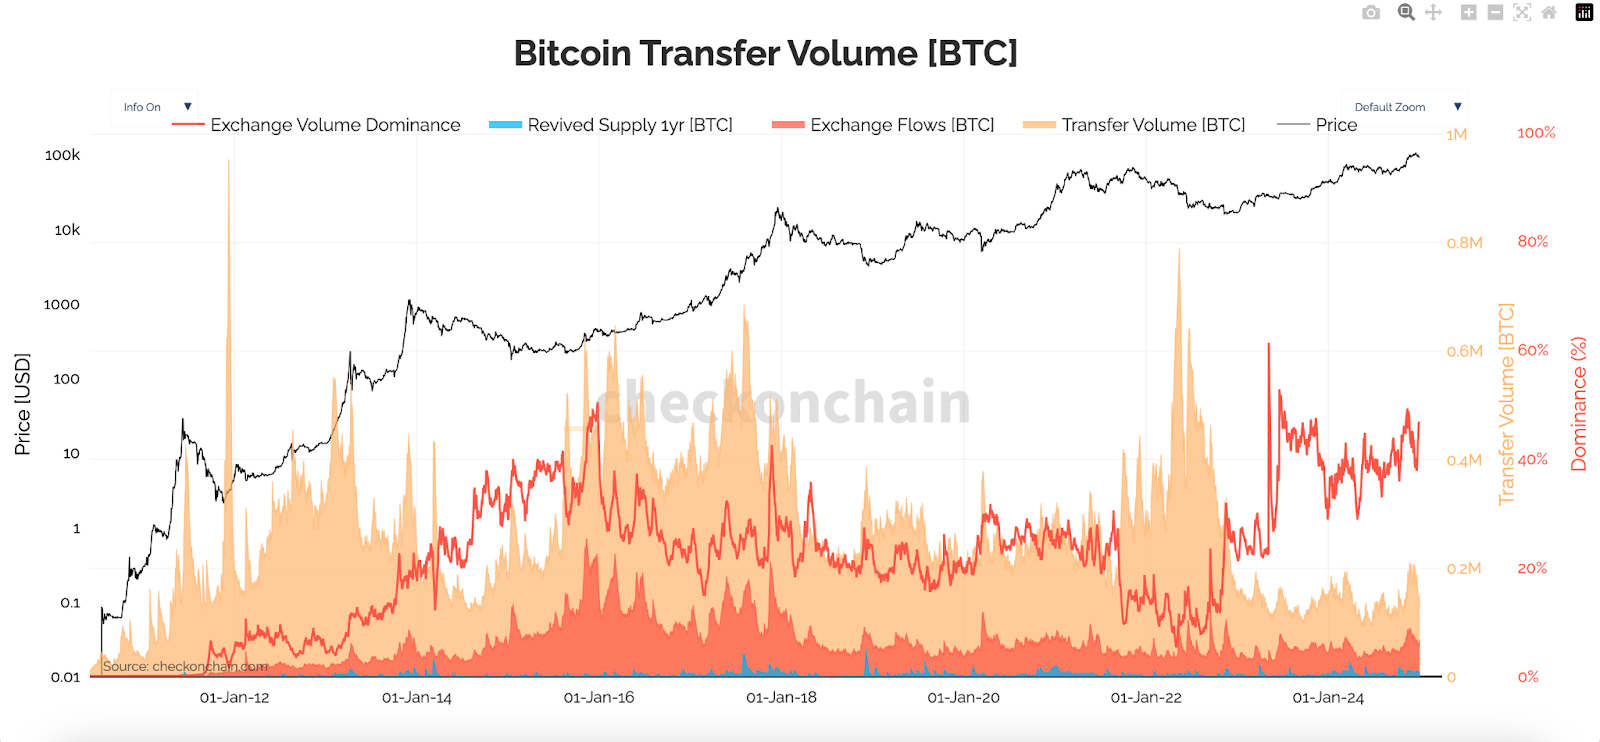
However, BTC-denominated daily exchange-related transfer volumes, including deposits and withdrawals, remained stable at 40,000-80,000 BTC in 2024 — a range consistent since 2018. Stable transfer volumes despite significant withdrawals suggest that holders are moving Bitcoin to cold storage rather than liquidating, signaling long-term confidence. In addition, it highlights steady trading behavior, implying the market remains active and balanced despite reduced exchange reserves.
Approximately 40% of Bitcoin’s transaction volume was linked to exchanges, fluctuating from a local low of 29% in April to a high of 49% in November. While still below the 61% peak of May 2023, this new baseline reflects the enduring influence of exchanges within Bitcoin’s ecosystem, even as OTC platforms gain popularity among institutional investors.
OTC Platforms
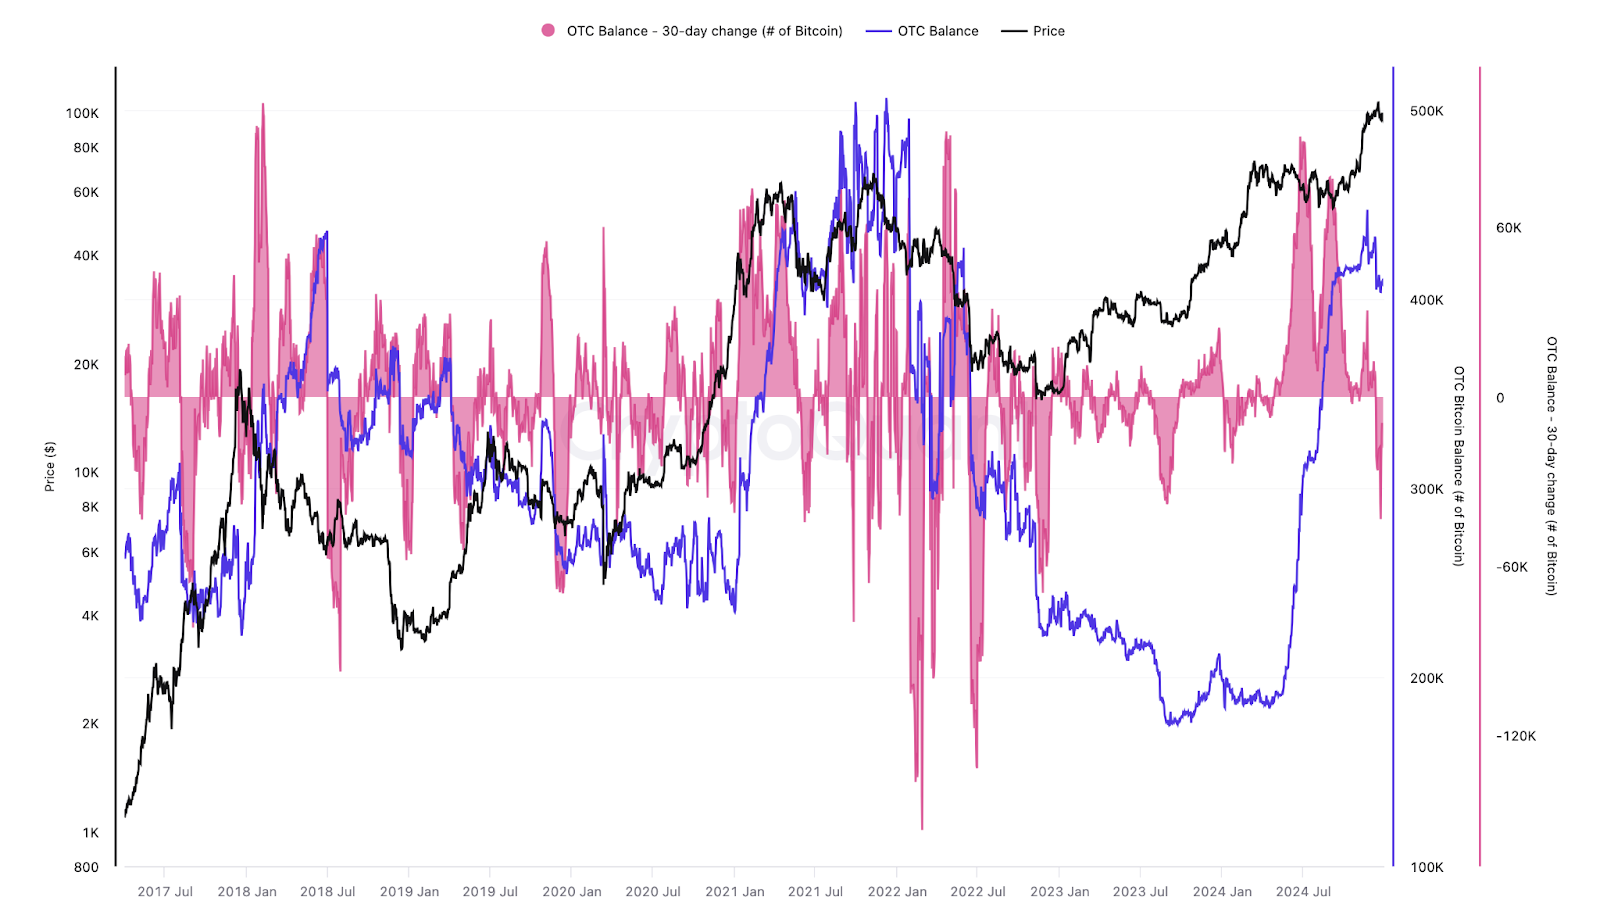
While exchange reserves saw a decline in 2024, OTC platforms accumulated over 208,000 BTC, increasing their balances by 105% year-on-year. As a result, OTC platforms now hold over 400,000 BTC, their highest level since 2022. This increase could signal preparation for higher demand, especially amid increased buying pressure in Q1.
In addition, this dynamic highlights a potential redistribution of supply from exchanges to OTC platforms. This trend not only diversifies the liquidity landscape but also underscores the market’s evolving dynamics as institutional players solidify their presence.
Looking into 2025
During previous bull runs in 2017 and 2021, both exchange and OTC reserves trended upward alongside increased market activity and revived supply. This historical pattern suggests a potential recurrence in 2025, albeit with a stronger influence from institutional and high-net-worth investors. While the risk of a supply shock remains low for now due to a significant margin of safety on exchanges and OTC platforms, a continued decrease in reserves could amplify upward price movement during this cycle.
Market Depth
Aggregated Market Depth Breakdown
To assess exchanges’ resilience amid record outflows, let’s dive into their liquidity dynamics using the 2% market depth. This metric measures the cumulative volume of bids and asks within 2% of the mid-price, providing a snapshot of liquidity and market stability.
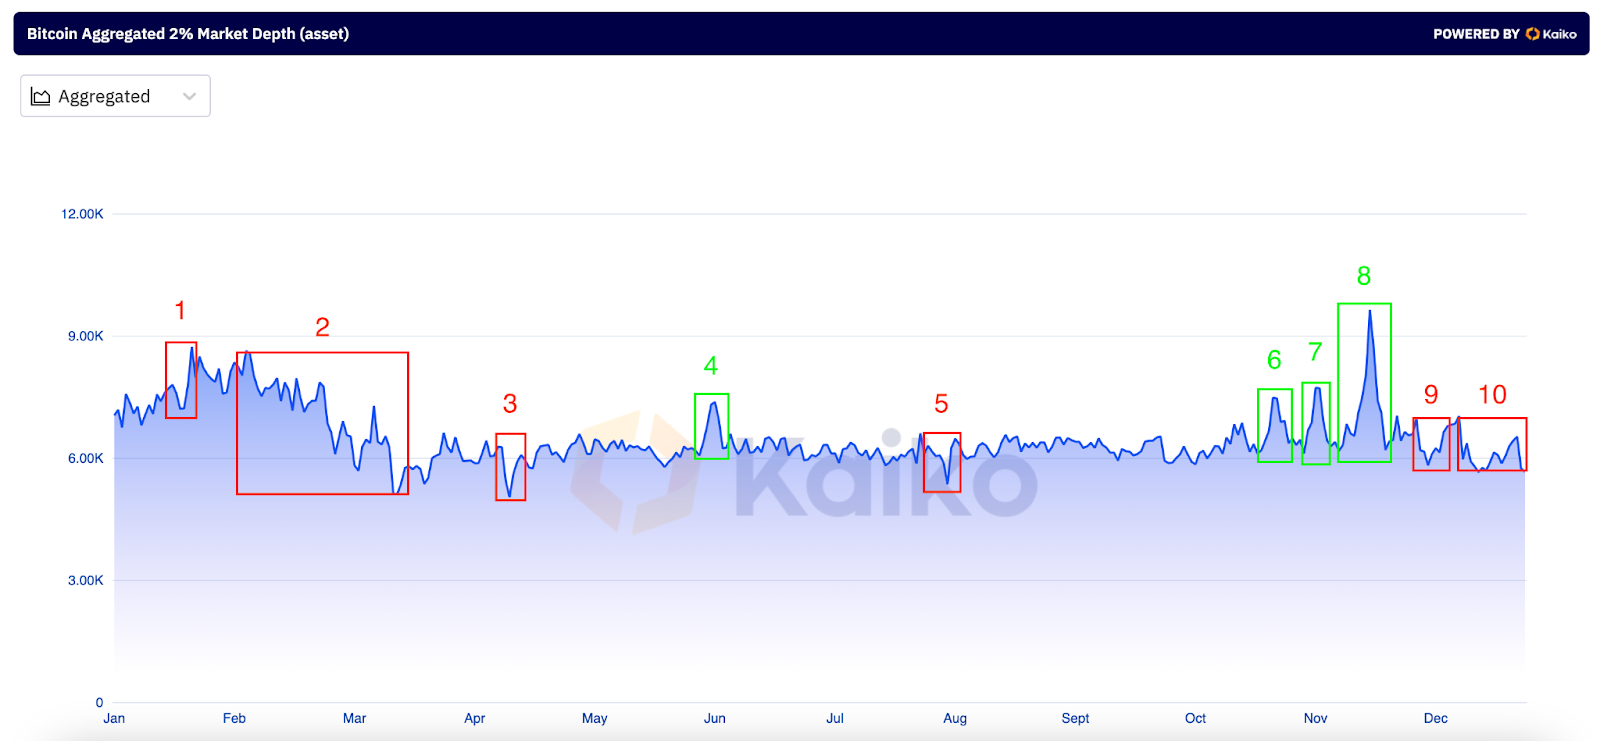
In 2024, the USD-denominated 2% market depth increased by 61%, while the BTC-denominated value decreased by 26%, with a notable drop in Q1 (2). This early-year decline likely stemmed from liquidity reassessments following Bitcoin’s rapid price appreciation, and a shift toward OTC platforms driven by institutional activity.
Local peaks and valleys in market depth can be attributed to several catalysts:
(1, 9) Altcoin seasons.
(3) Geopolitical events, such as Israel’s attack on Iran.
(4, 6) Bitcoin’s rally to challenge an all-time high.
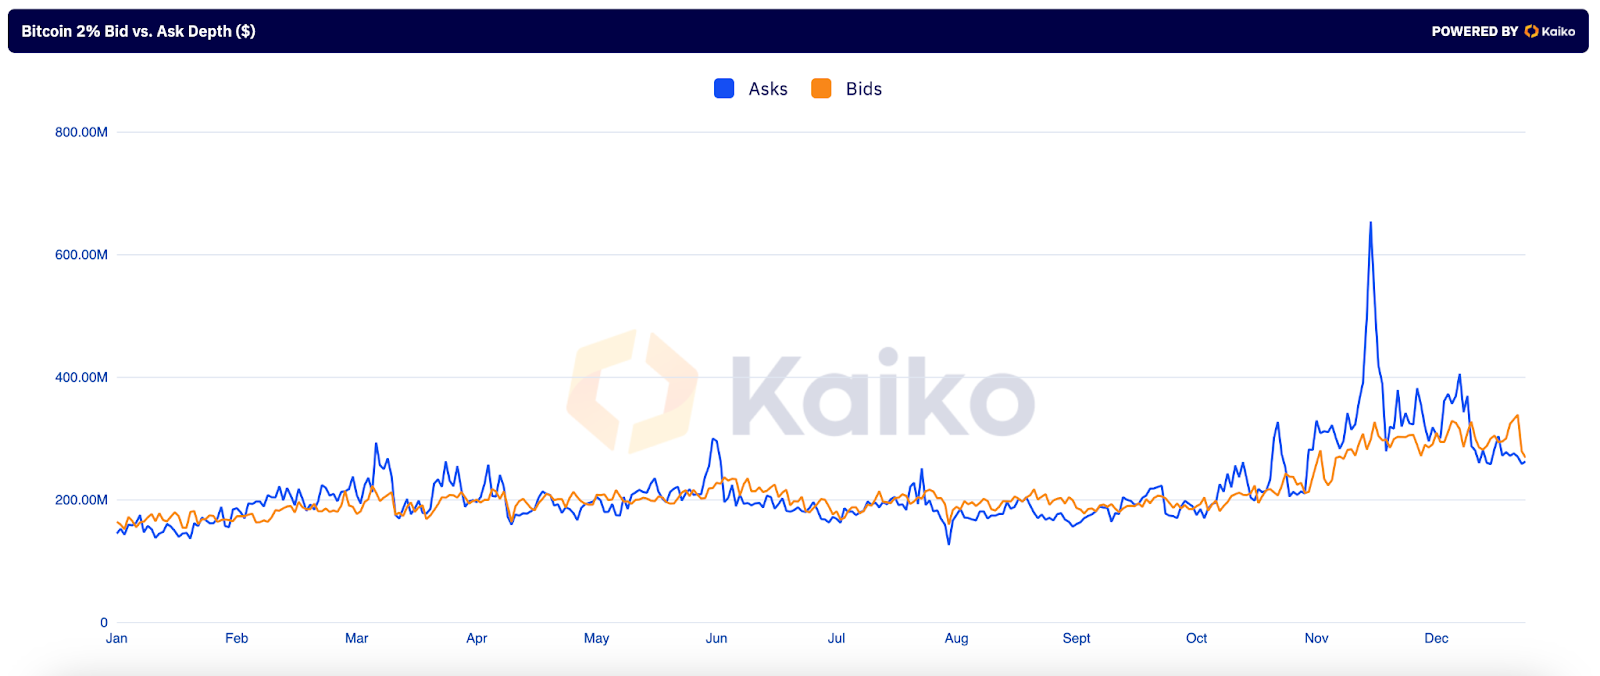
Notably, throughout the year, asks exceeded bids approximately 58% of the time, highlighting consistent selling interest. Despite this, buyers aggressively absorbed sell orders, driving price appreciation and signaling a strong accumulation phase. Sellers attempted to capitalize on rising prices, but robust underlying demand prevented a reversal of the bullish trend. The largest disparity between asks and bids occurred in late November, following the announcement of SEC Chair Gary Gensler’s resignation.
Liquidity Changes Between Exchanges
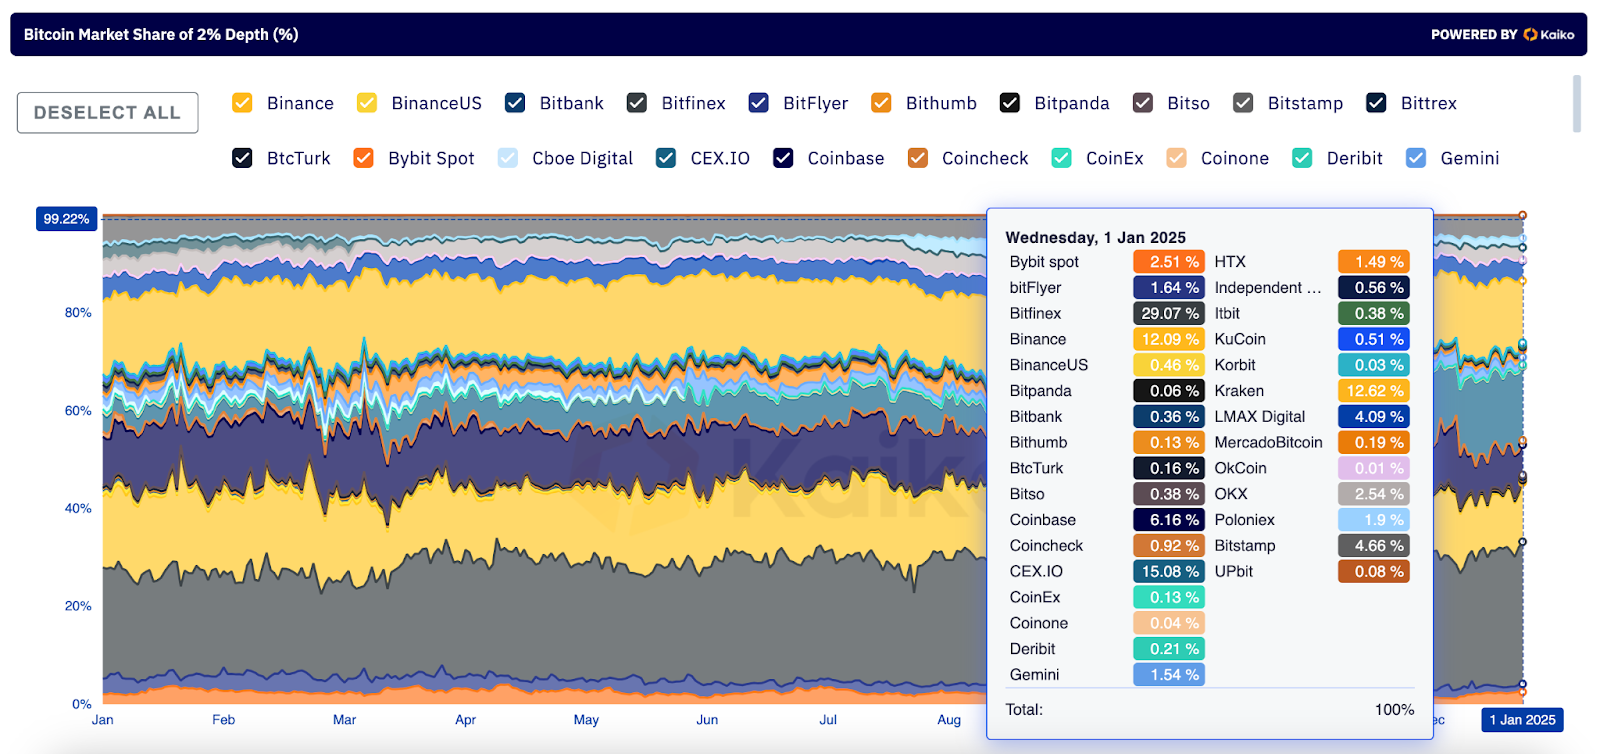
The liquidity landscape across exchanges has also shifted significantly in 2024, with top exchanges consolidating their market share. According to Kaiko data that includes 33 major exchanges, the top three exchanges in terms of 2% market depth now account for 57% of the market, up from 53% at the start of the year. At the time of this writing, these exchanges include Bitfinex, Kraken, and CEX.IO, with the latter quadrupling its market share in 2024.
Notably, since CEX.IO’s trading engine utilizes liquidity aggregated across multiple sources, its market depth increase partially contributed to the rising share of certain exchanges. Much of CEX.IO’s growth occurred in Q4, following an update to its aggregation engine that expanded liquidity sourcing and enabled near-zero spreads on most trading pairs, including Bitcoin.
Note: The performance from January 1, 2024, to January 1, 2025.
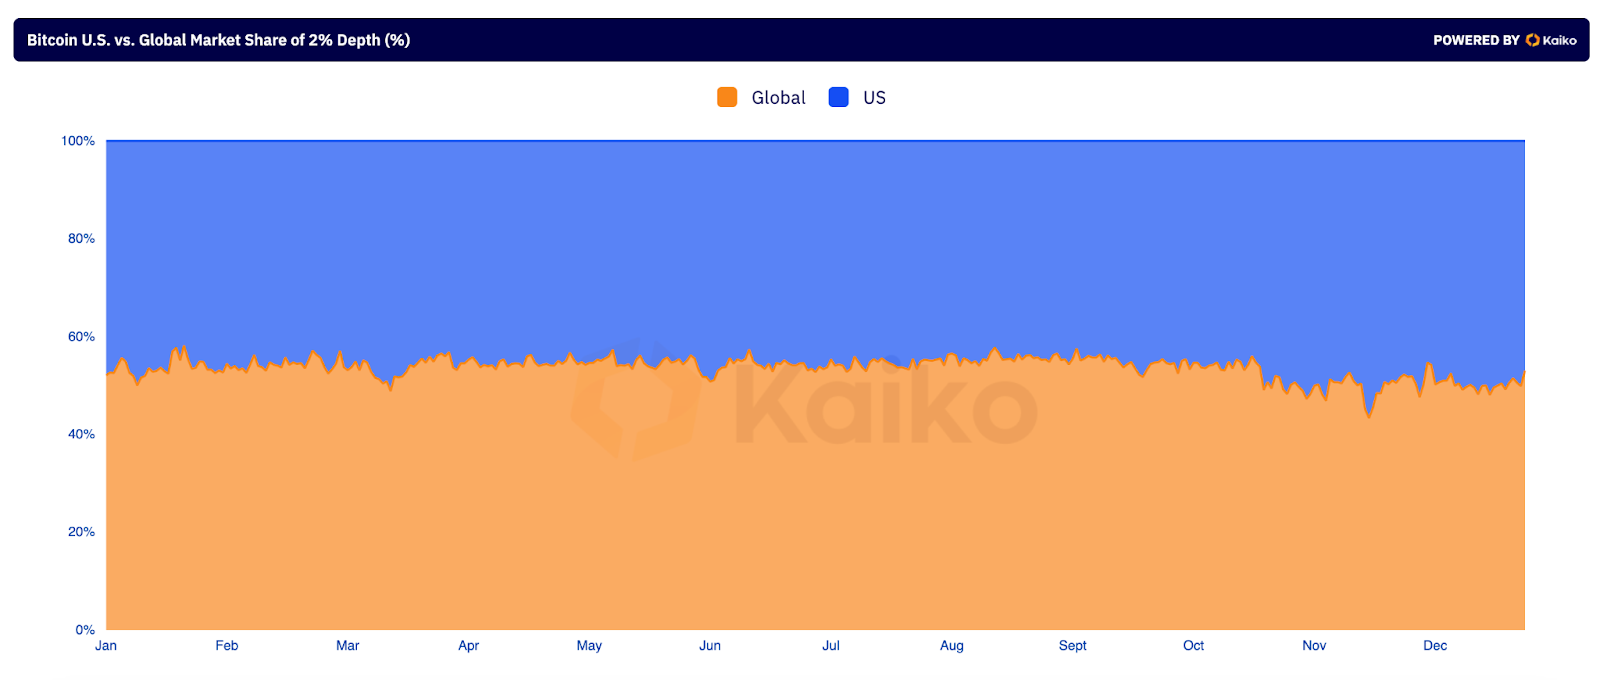
Geographic trends showed that there primarily was a 55/45 parity in market depth between non-U.S. and U.S. exchanges. Following the U.S. elections, U.S. exchanges temporarily dominated market depth, contributing to November’s price rally. Brief spikes in U.S. exchange liquidity were also observed in March, June, and October, coinciding with Bitcoin’s price reaching or approaching all-time highs.
Looking into 2025
When observing liquidity, it’s important to keep in mind that USD-denominated depth remains a key liquidity metric for many traders and institutions. As a result, despite a drop in BTC terms, overall liquidity improved in 2024. This sets up the stage for further enhancement in 2025, as Bitcoin’s cyclic bull runs have been typically associated with increased liquidity.
Larger exchanges are likely to solidify their dominance, building on their recently increased market share. In turn, market depth will likely continue shifting towards U.S. exchanges, as trading becomes increasingly concentrated on U.S. hours.
Conclusion
Although the supply and liquidity developments of 2024 have laid a strong foundation for Bitcoin’s potential upward momentum this year, it appears to be too early to declare the onset of a supercycle, with a massive supply shock and no prolonged bear market. Bitcoin continues to maintain a substantial margin of safety, with millions of BTC poised for sale as market indicators start signaling a potential cycle top. This awaiting supply acts as a natural counterbalance to unbridled optimism, reinforcing the persistence of the 4-year cycle theory. Despite the allure of overbullish expectations, this cyclical framework appears likely to shape Bitcoin’s market dynamics for the foreseeable future.
The web content provided by CEX.IO is for educational purposes only. The information and tools provided neither are, nor should be construed as, an offer, or a solicitation of an offer, or a recommendation, to buy, sell or hold any digital asset or to open a particular account or engage in any specific investment strategy. Digital asset markets are highly volatile and can lead to loss of funds. The availability of the products, features, and services on the CEX.IO platform is subject to jurisdictional limitations. To understand what products and services are available in your region, please see our list of supported countries and territories. This page includes additional links to information about individual products, and their accessibility.
Stablecoin supply grew over 59% in 2024, reaching 1% of the U.S. dollar supply but lost 13.5% in weight within the total crypto market cap.
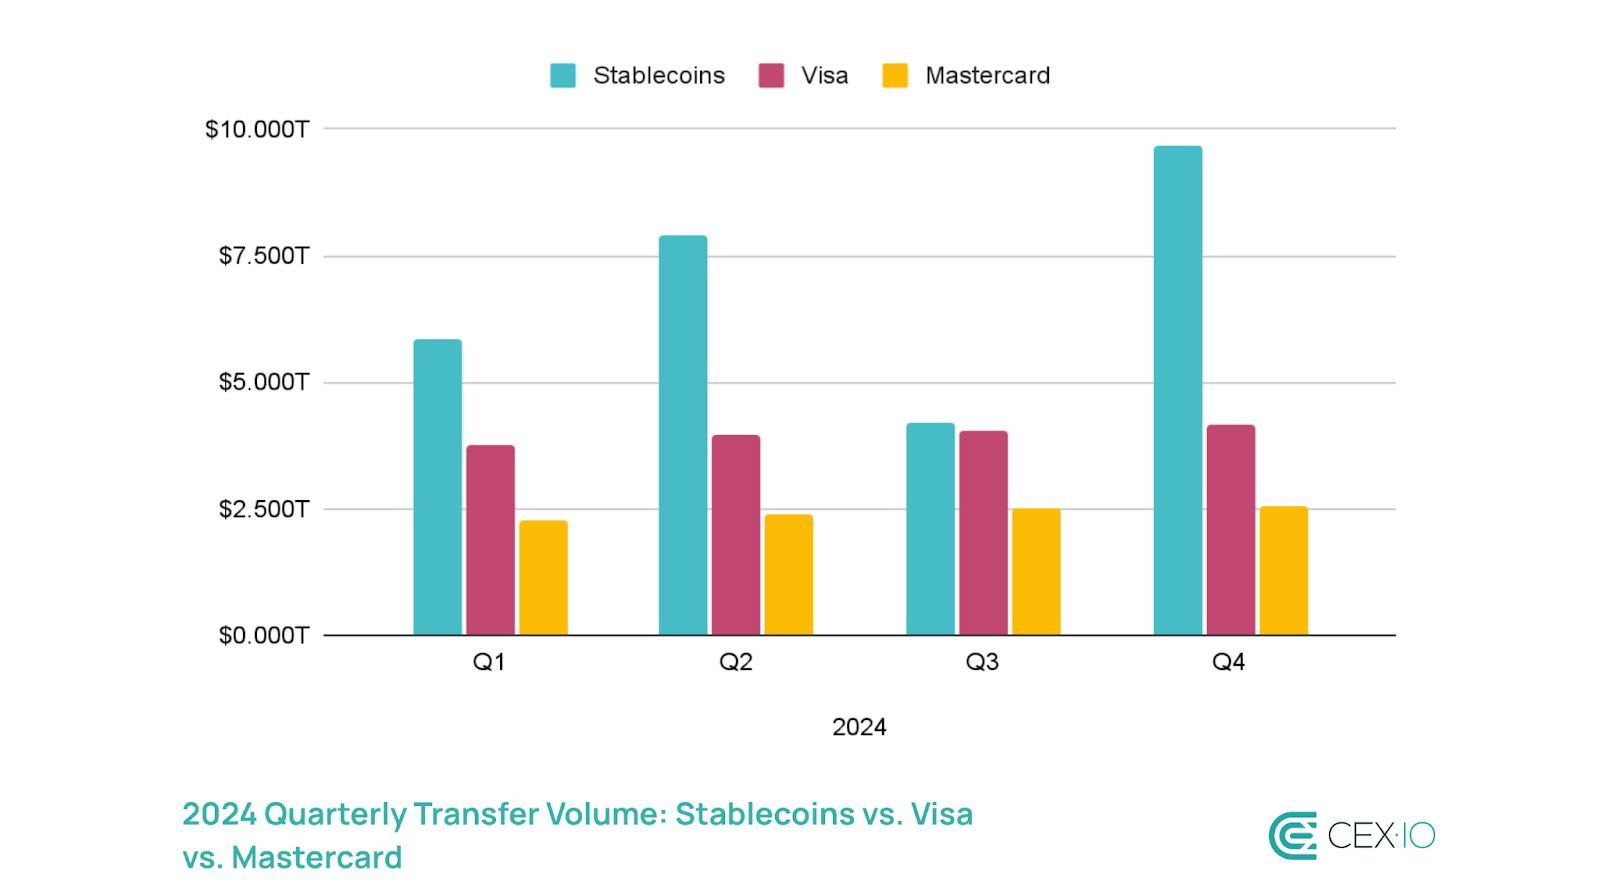
The annual stablecoin transfer volume reached $27.6 trillion, surpassing a combined volume of Visa and Mastercard in 2024 by over 7.68%.
70% of stablecoin transaction volume in 2024 was related to bot activity. In Solana and Base networks bot transactions accounted for 98% of the volume.
Yield-bearing stablecoins now account for over 3% of the stablecoin market, and became a major driver behind a 414% surge in market cap of tokenized treasuries.
Ethereum and Tron dominance in hosting stablecoins decreased from 90% to 83%, with Base, Solana, Arbitrum, and Aptos capturing most of this share.
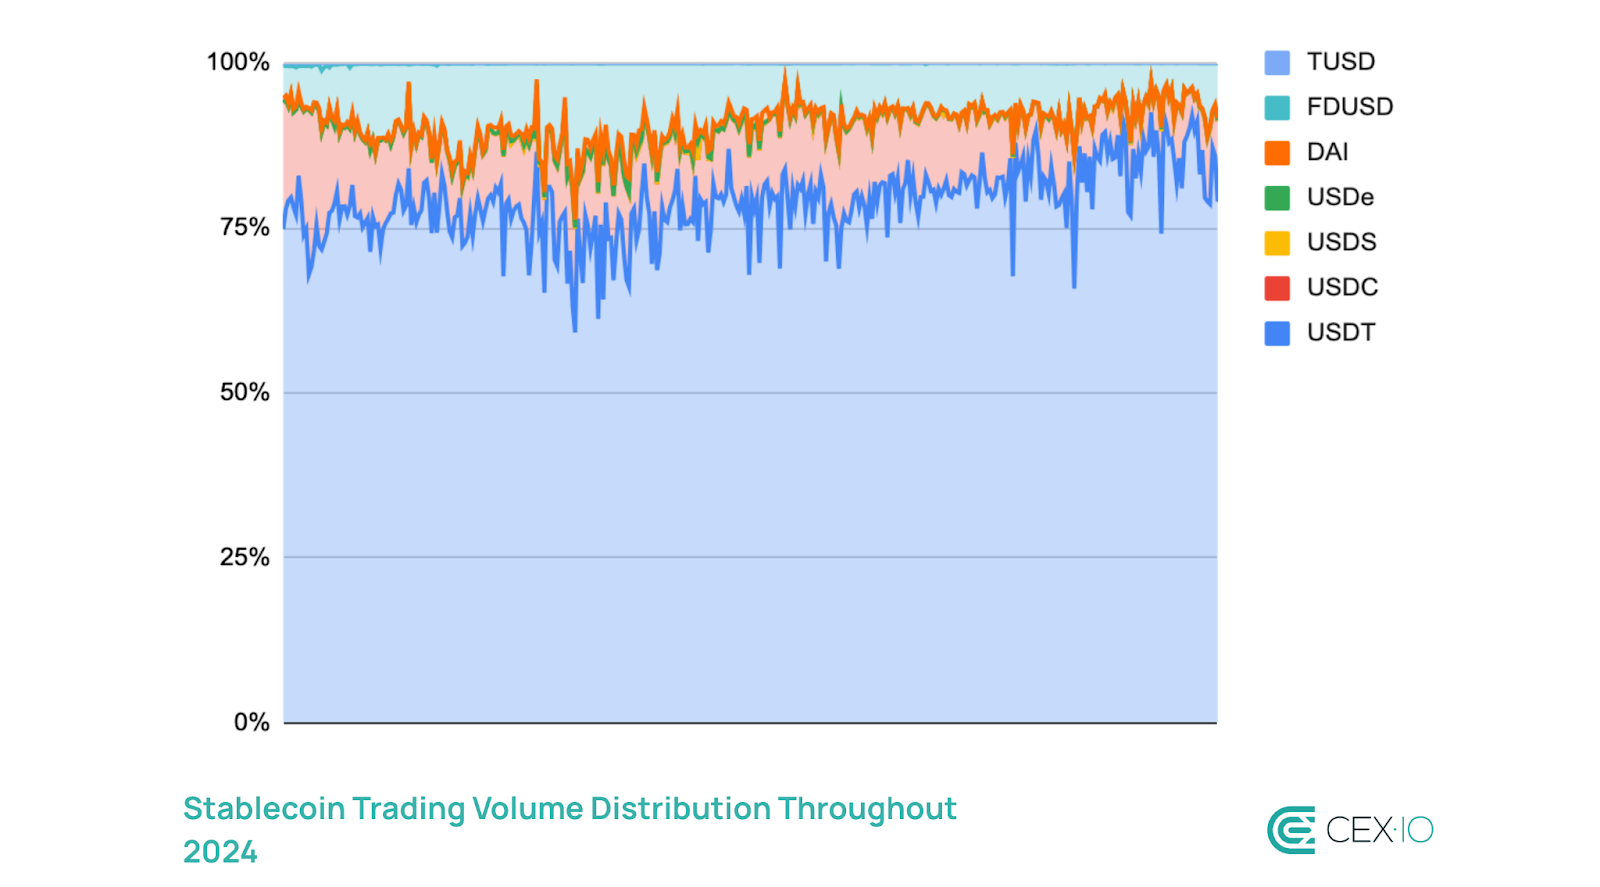
Stablecoins registered over $25.8 trillion in aggregated trading volume in 2024, continuing to gain market share over fiat-to-crypto trading.
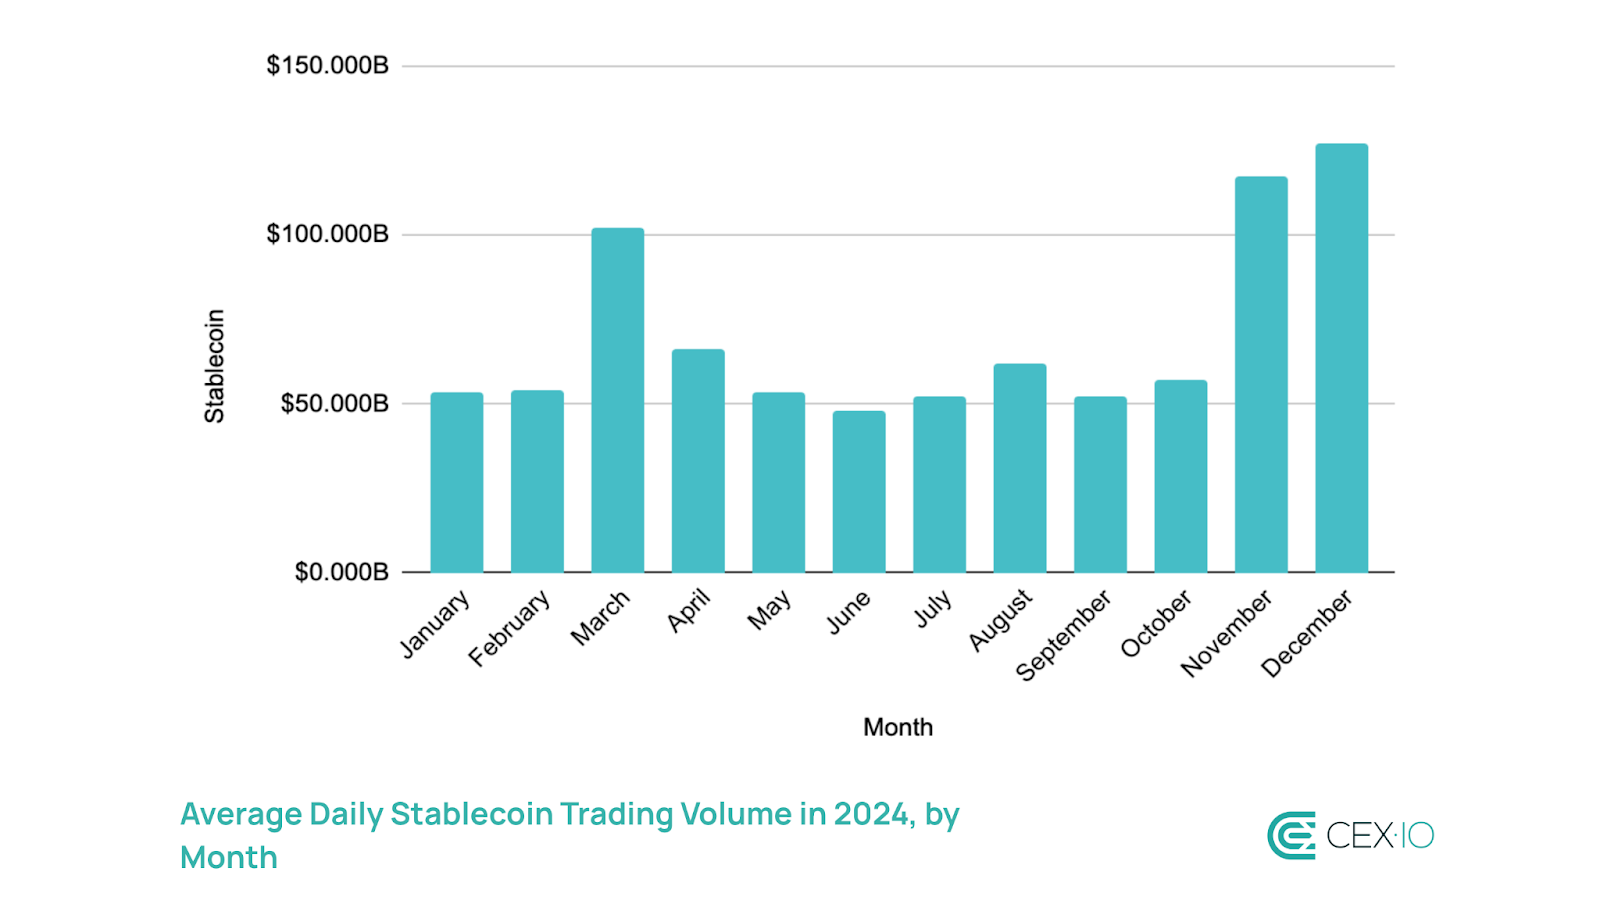
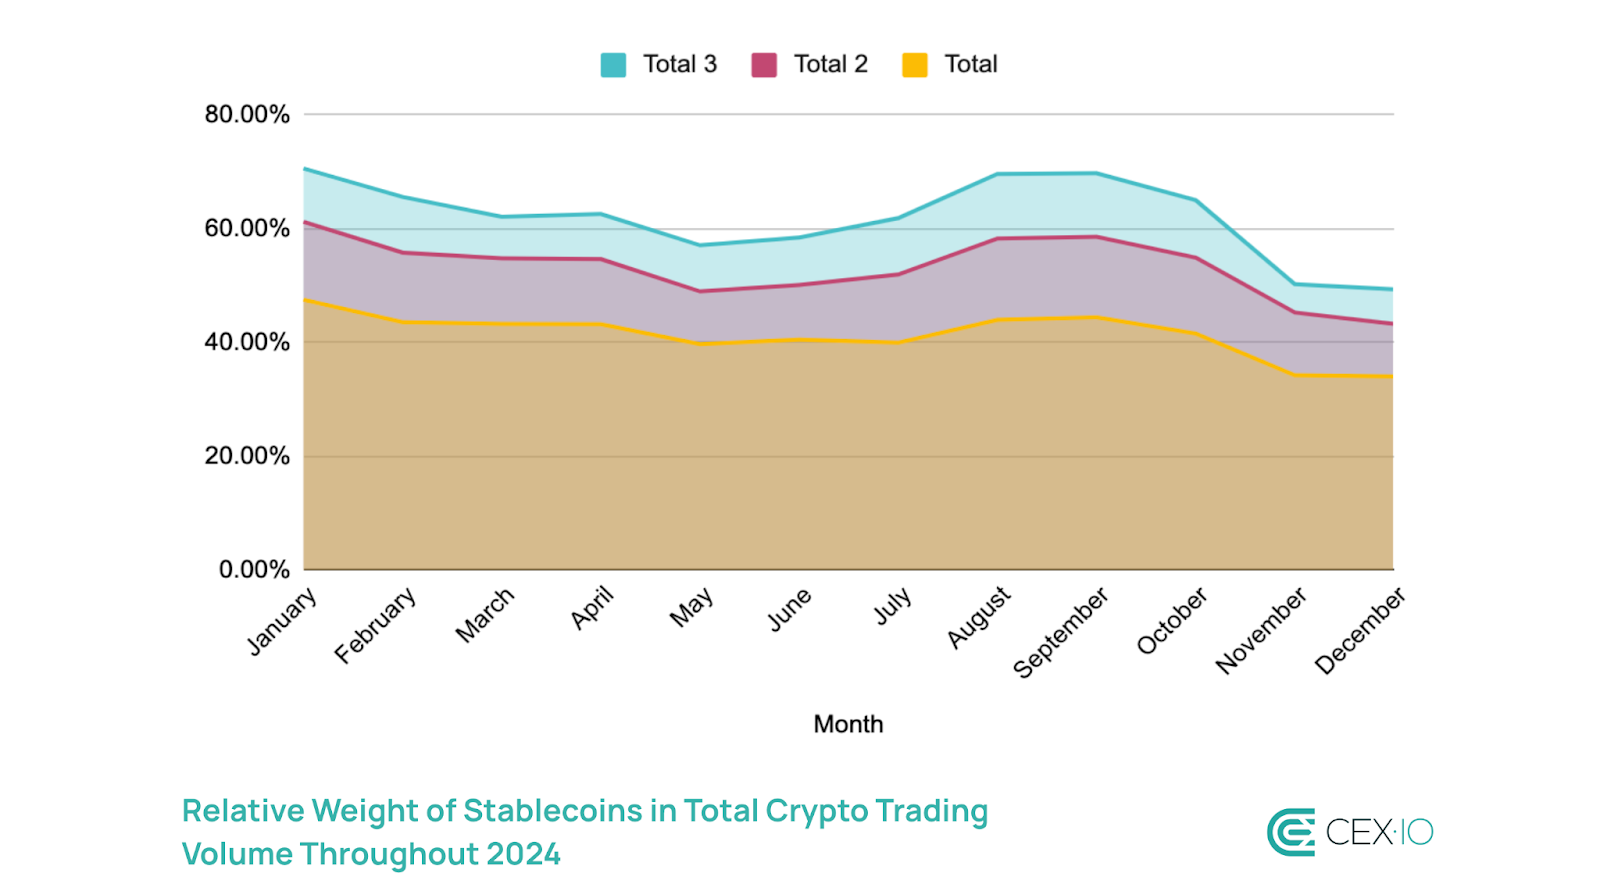
The average daily trading volume among stablecoins soared by over 237% in a year. However, the relative weight of stablecoin volume declined compared to total crypto volumes due to increased adoption of derivative products.
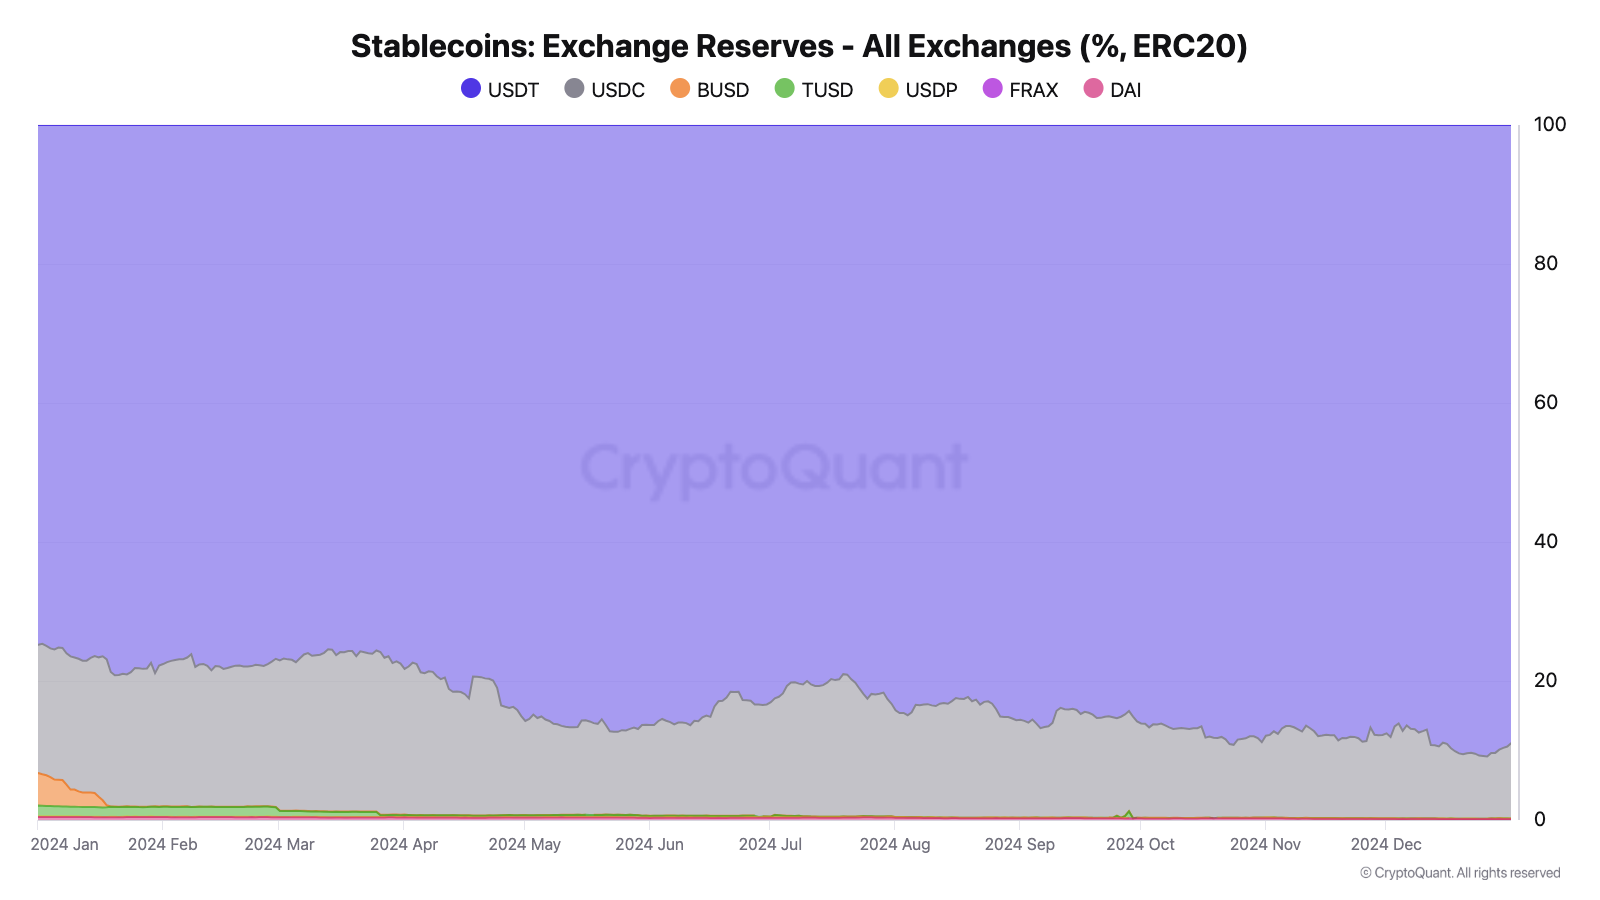
USDT accounted for 79.7% of stablecoin trading volume on average, and strengthened its positions amid surged stablecoin reserves on centralized exchanges.
Introduction
While memecoins and AI have been among the most profitable crypto narratives in 2024, stablecoins have emerged as one of the most impactful, serving as a major driver of crypto adoption. This adoption has accelerated not only among retail investors, who increasingly use stablecoins for savings and payments, but also among financial institutions.
While PayPal began using its proprietary stablecoin for business transactions, other fintech companies have been catching up, with Stripe acquiring a stablecoin issuance platform, Ripple launching RLUSD, and Robinhood, Kraken, and Galaxy collaborating to create a global stablecoin network. This trend continues to gain momentum, as Revolut considers developing its own stablecoin and Visa introduces a platform to help banks manage their stablecoins.
All of this suggests that stablecoins are set to become an even fiercer battlefield between traditional and crypto-native companies. To assess what to expect from stablecoins in 2025, we examined the current state of the sector and its developments over the past year.
Methodology
To provide an in-depth and comprehensive analysis of stablecoin trends, this report utilizes a diverse range of trusted sources, including DeFiLlama, Artemis, The Block, Visa/Allium, CoinGecko, CryptoQuant, Checkonchain, and GrowThePie. These platforms provided key metrics on stablecoin supply, on-chain activity, and trading dynamics to validate market developments across fiat-backed, crypto-backed, algorithmic, and yield-bearing stablecoins.
In addition, the report incorporated a comparative analysis of network-specific dynamics, capturing the evolving roles of Layer 1 (L1) and Layer 2 (L2) networks in the stablecoin ecosystem. To accurately reflect genuine transaction activity, this analysis highlights both total unfiltered data and adjusted metrics that exclude internal smart contract transactions, internal exchange transfers, and bot-driven activity.
Supply by Categories
Total Supply
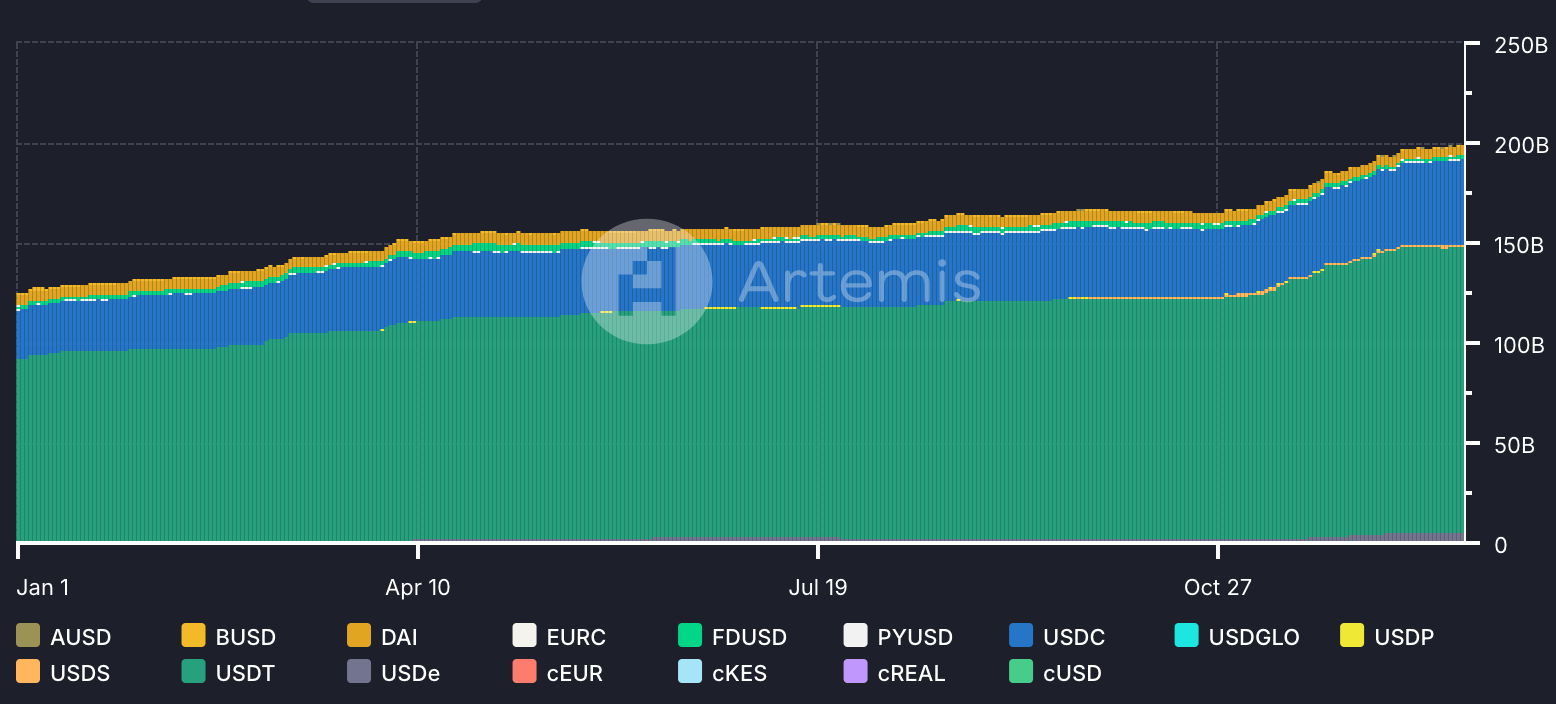
In 2024, the total stablecoin supply increased by over 59%, reaching a new all-time high in September, and surpassing $200 billion. Stablecoins now account for around 1% of the total U.S. dollar supply, up from 0.63% at the beginning of 2024.
The sector showed consistent increase throughout the year, accelerating its pace in Q1 and Q4 to complement the wider market growth during these periods. Despite this, the relative weight of the stablecoin sector to the total crypto market cap decreased from 8% to 6% during the year, as other sectors within the crypto market experienced higher increase.
Chart: Total Stablecoin Supply Trends in 2024
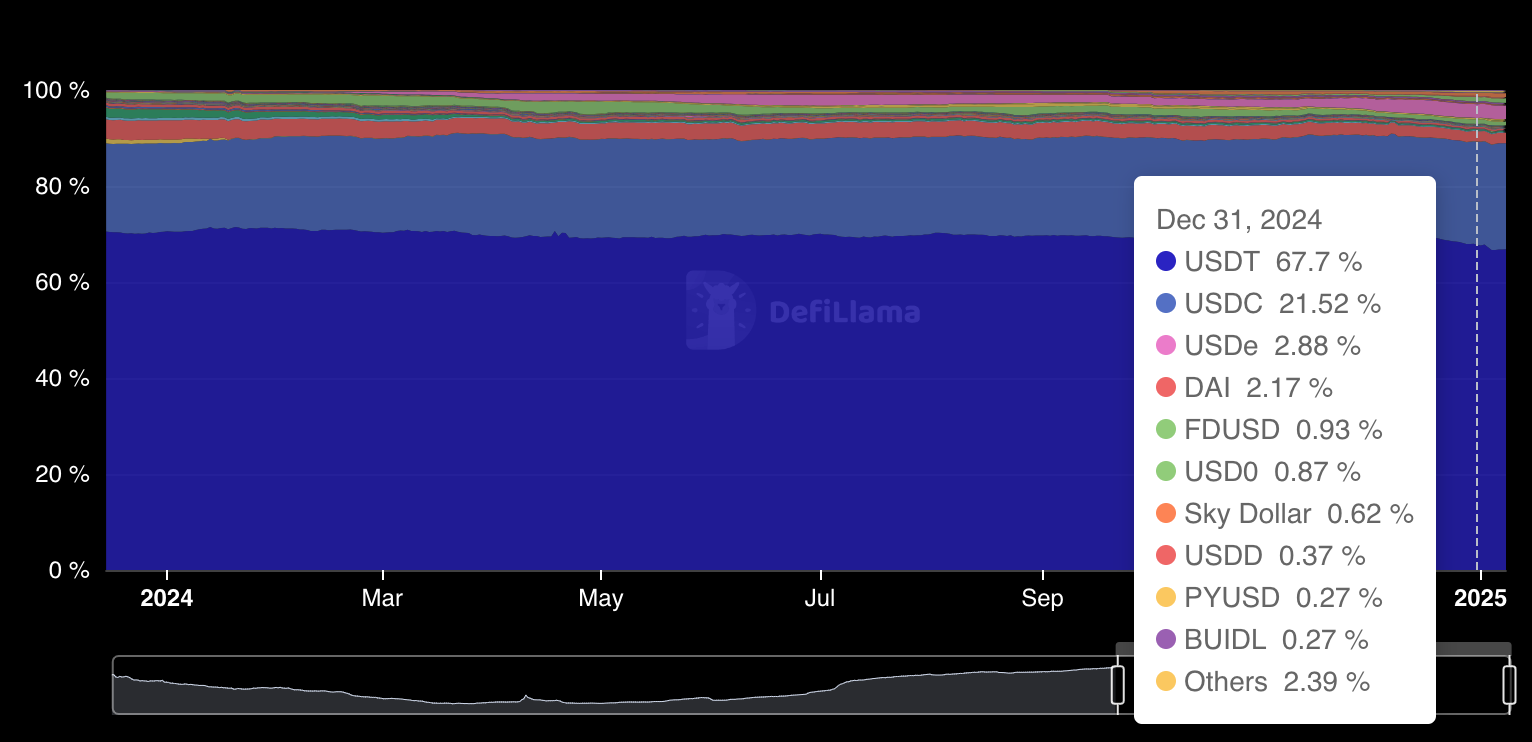
The supply distribution across top stablecoins has seen slight changes, with USDT remaining a dominant stablecoin, but its share in total supply decreasing from 70.5% to 67.7%. In turn, USDC marked a similar margin of growth to USDT’s decline, registering an increase in market share from 18.4% to 21.5%. This increase in USDC market share partly occurred due to its status as a more preferred stablecoin for decentralized finance (DeFi). In 2024, the total value locked (TVL) across the DeFi sector has nearly doubled, fueling heightened demand for USDC.
As for lower-cap stablecoins, Ethena’s USDe emerged as a standout performer, with its market share skyrocketing by over 40 times to 2.88%, securing its position as the third-largest stablecoin by the end of 2024.
Chart: Total Supply Distribution by Stablecoin
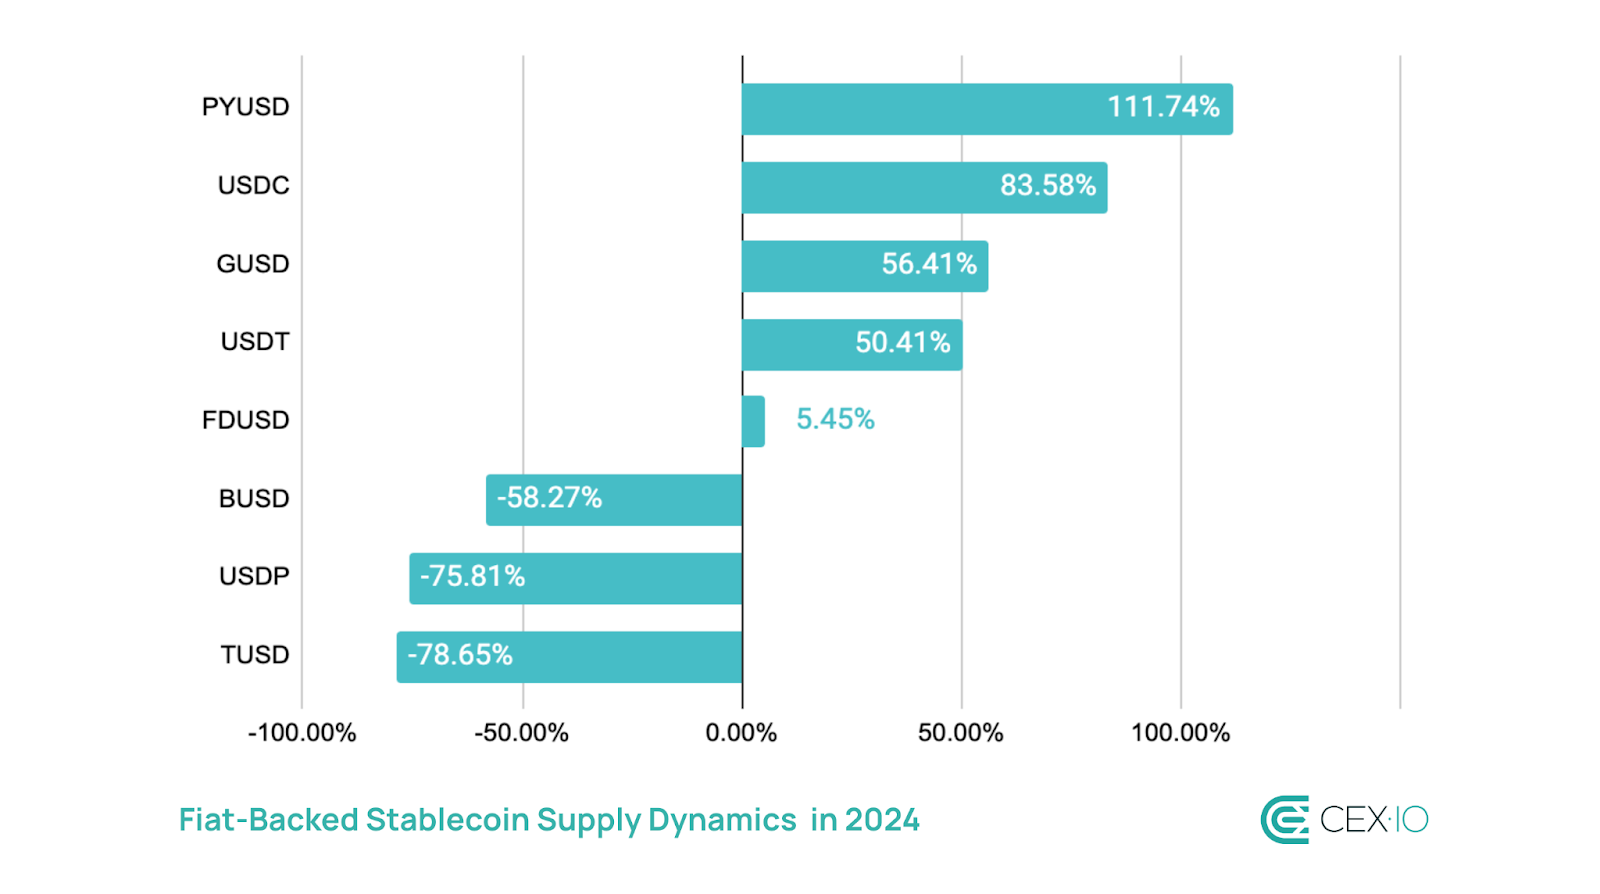
Fiat-Backed Stablecoins
Fiat-backed stablecoins maintained their dominance, but experienced nuanced shifts. The total supply of fiat-backed stablecoins grew by 54.8% in 2024, although their weight in the overall stablecoin market cap decreased from 93.62% to 92.2%. The major catalyst behind this drop was the rising adoption of yield-bearing stablecoins, which primarily utilize crypto-backed collateral and/or algorithmic peg preservation mechanisms.
PYUSD emerged as the leader in supply growth within this category in 2024, primarily due to its expansion to the Solana network mid-year. Solana even temporarily became the largest host of PYUSD, but then supply distribution shifted toward Ethereum.
TUSD saw the steepest decline, with its market cap contracting by over 78%, as the asset lost its top use case following an exclusion from Binance’s launchpool. The TUSD depeg and regulatory issues further escalated the stablecoin drop.
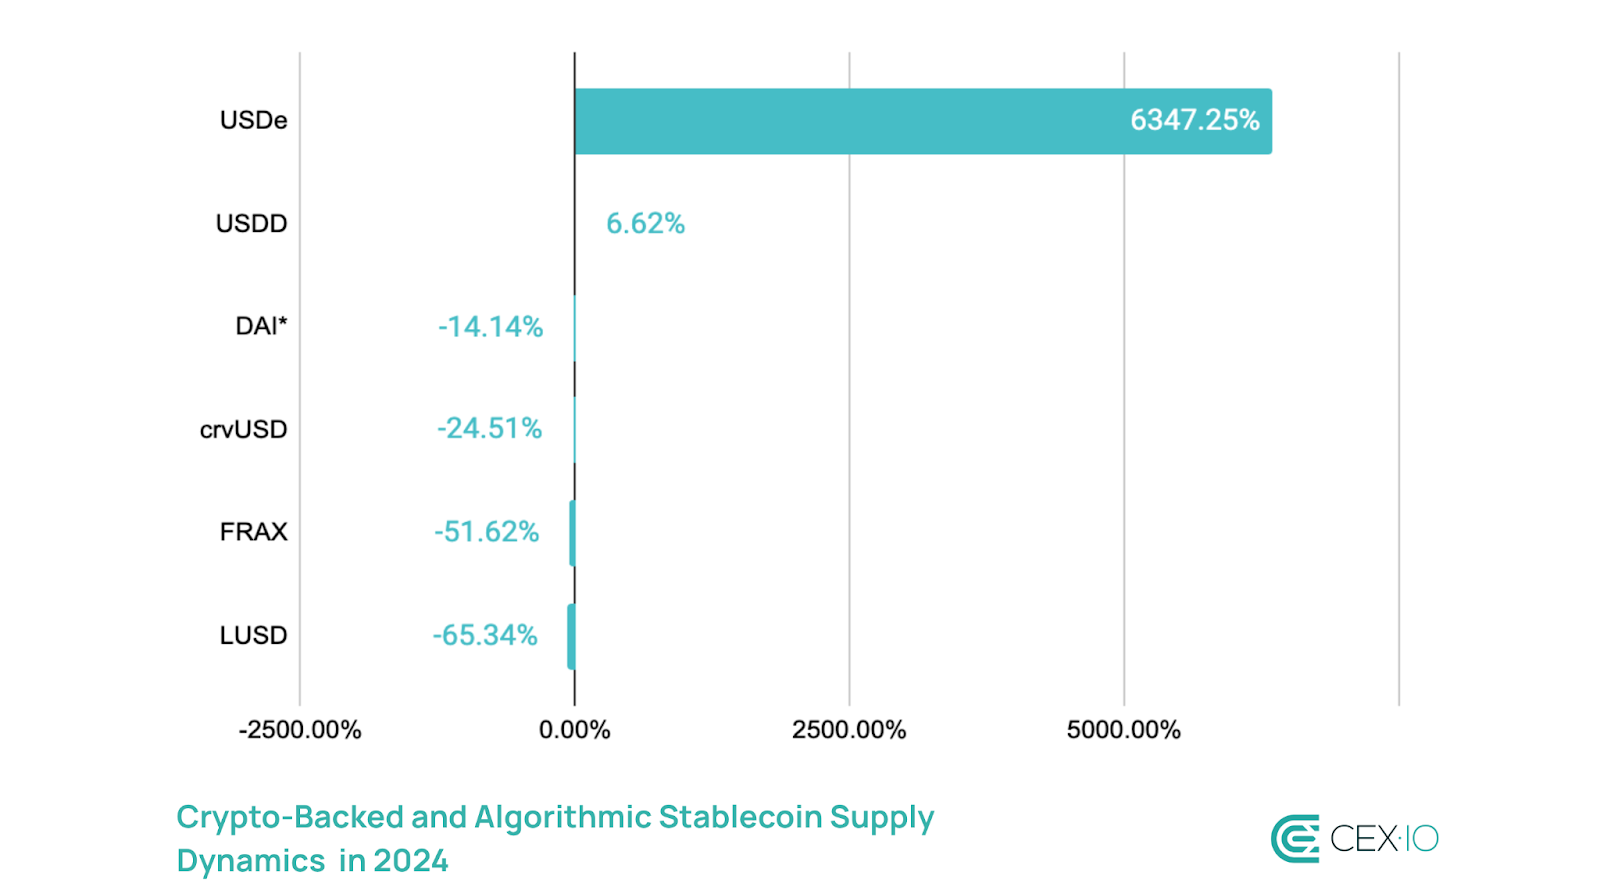
Crypto-Backed and Algorithmic Stablecoins
This category saw explosive growth in 2024, with its total supply increasing by 92%. However, this increase was primarily due to Ethena’s USDe emerging as a transformative force and registering a supply increase of over 6,300%, despite its controversial debut. USDe supply significantly ramped up in Q4, amid rising adoption of Ethereum-based stablecoins and the launch of staked USDe (sUSDe) on Aave. This helped the asset overtake DAI as the largest stablecoin in this category by December, now accounting for a 37% share of the sector.
Dai experienced a supply reduction due to the launch of USDS in September, its upgraded version that absorbed over $1 billion of DAI’s supply by the end of 2024. However, when combined, DAI and USDS supply reflected a 10% increase compared to DAI’s supply at the start of 2024.
*Dai performance exclude DAI upgraded to USDS
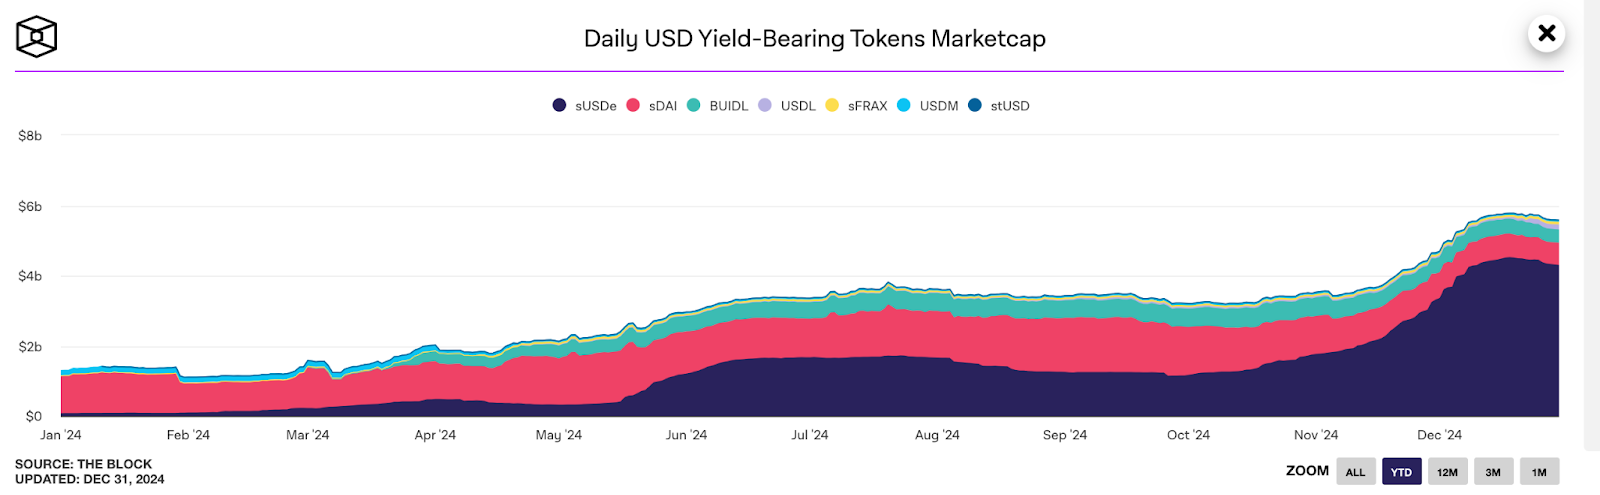
Yield-Bearing Stablecoins
Yield-bearing stablecoins emerged as one of the hottest segments in this space, with its combined market cap surging by over 583% in 2024. This jump was primarily due to adoption of sUSDe, which became the dominant force in this sector, with its market cap increasing by more than 5,800% in a year.
As such, the weight of yield-bearing stablecoins tripled in a year, now accounting for nearly 3% of the total stablecoin market. Notably, they gained traction despite facing a tightening regulatory environment. At the end of 2023 a U.S. court ruled that stablecoins in combination with related yield protocols such as Terra’s UST are securities.
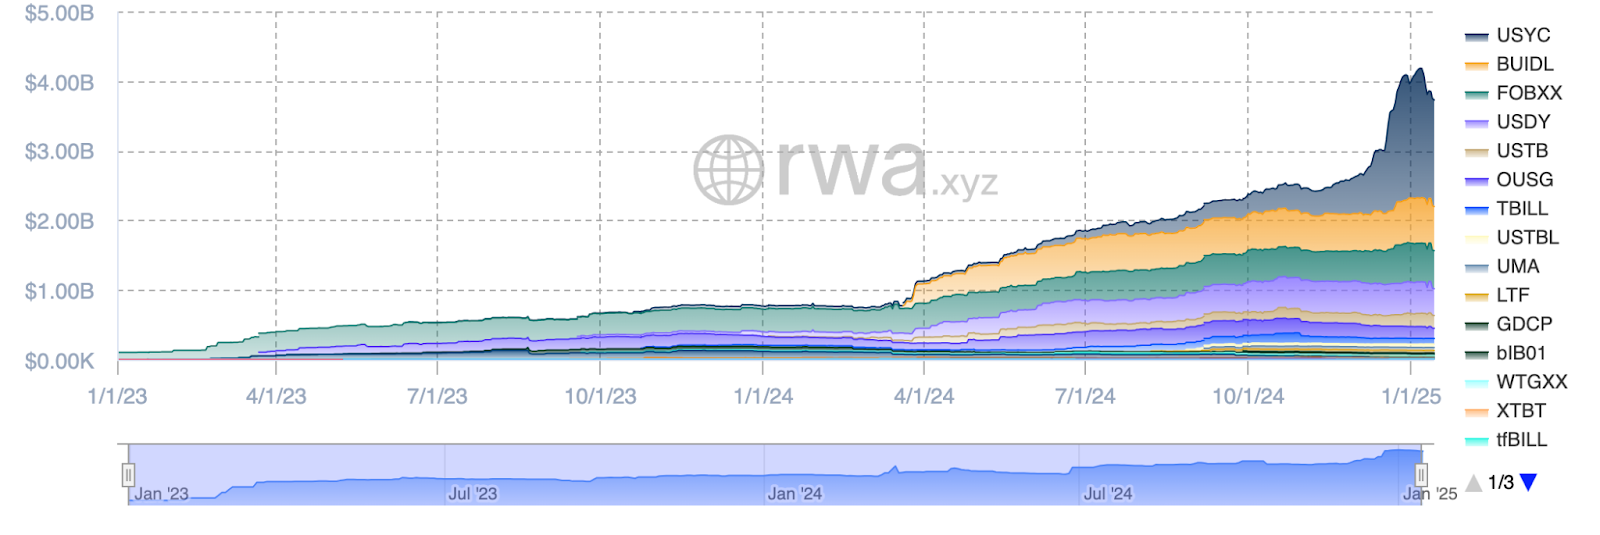
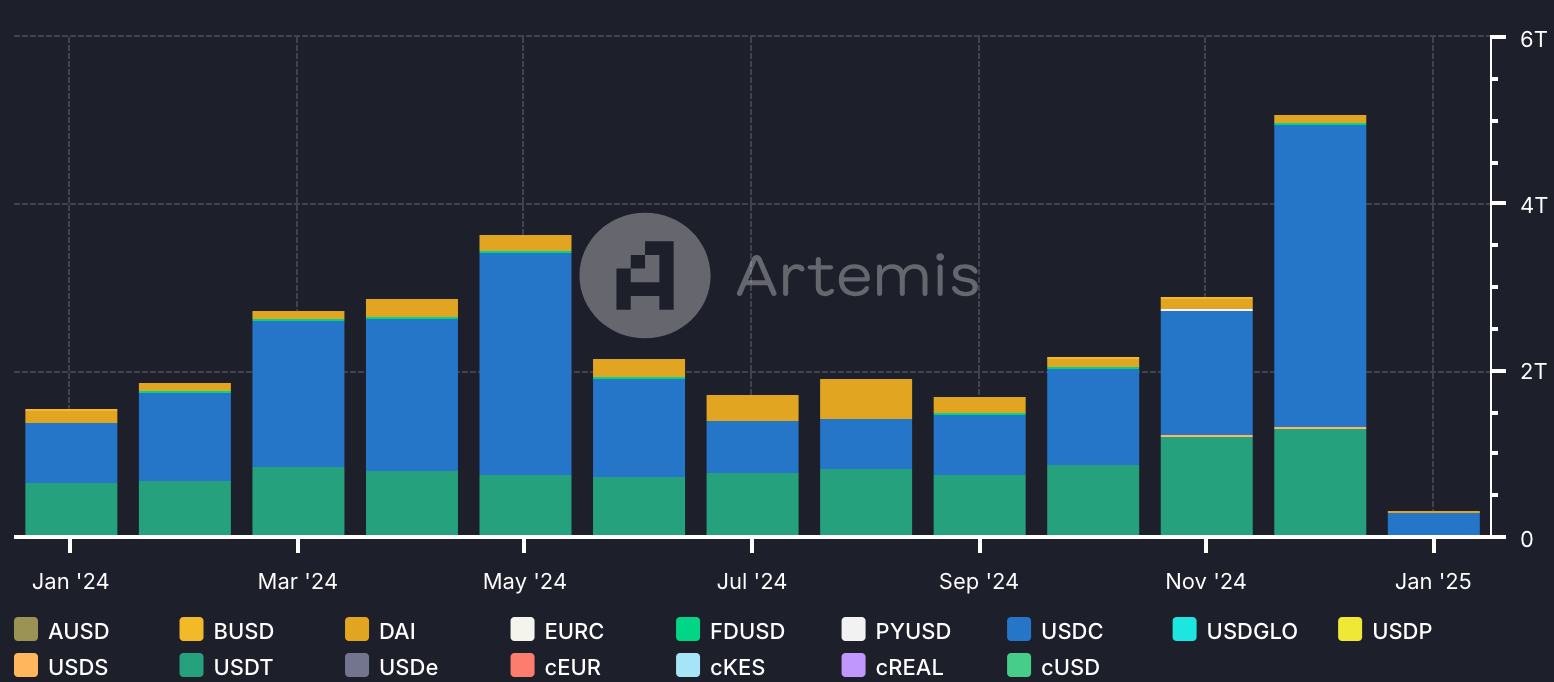
While sUSDe adopts a “delta-neutral” trading strategy involving long and short positions to generate yield, the wider yield-bearing stablecoin segment followed a different route focused on real-world assets (RWA), especially U.S. Treasuries. The sector of tokenized treasuries surged by over 414% last year, primarily due to the adoption of newly launched yield-bearning stablecoins and RWA projects, including BlackRock’s BUIDL, Paxos’ USDL, Mountain Protocol’s USDM, and Usual Money’s USD0.
USD0 showed the largest surge among RWA-focused stablecoins, reaching a market cap of $1.7 billion and achieving a 39-fold increase in supply since its inception in June 2024. Due to USD0’s rapid growth, USYC, which serves as a primary backing asset for USD0, became the largest holder of tokenized U.S. Treasury bonds, now accounting for over 40% of the market.
Chart: U.S. Treasury Market Cap Among RWA Projects
Supply by Network
General Distribution
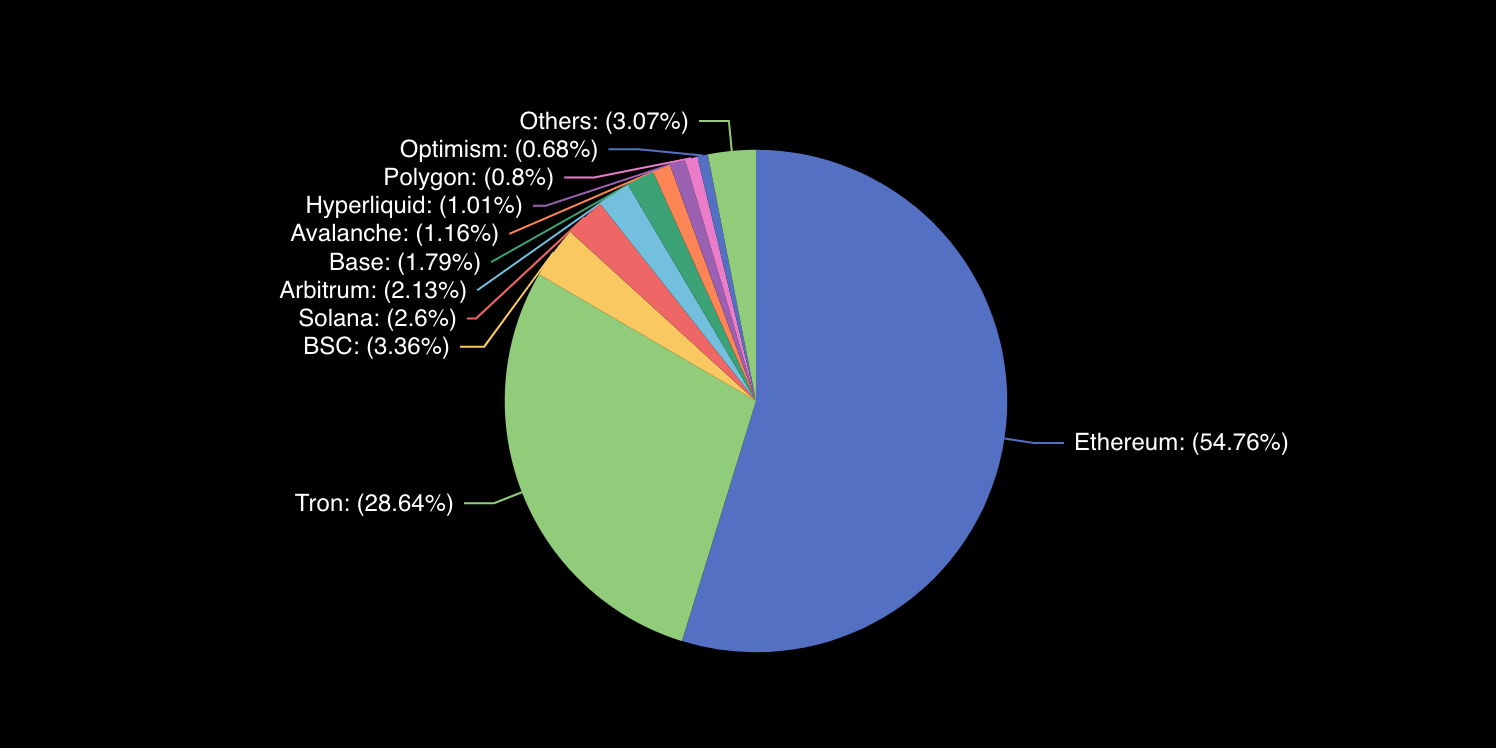
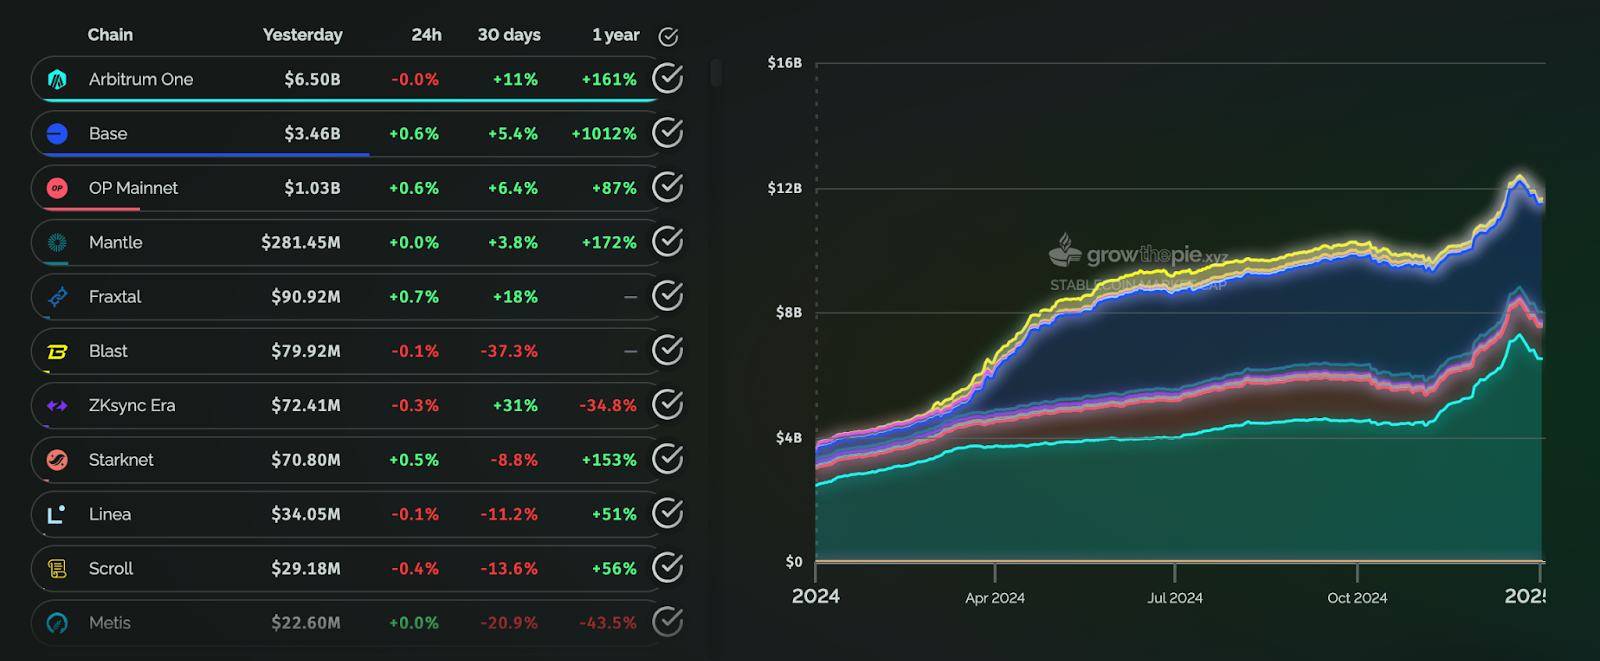
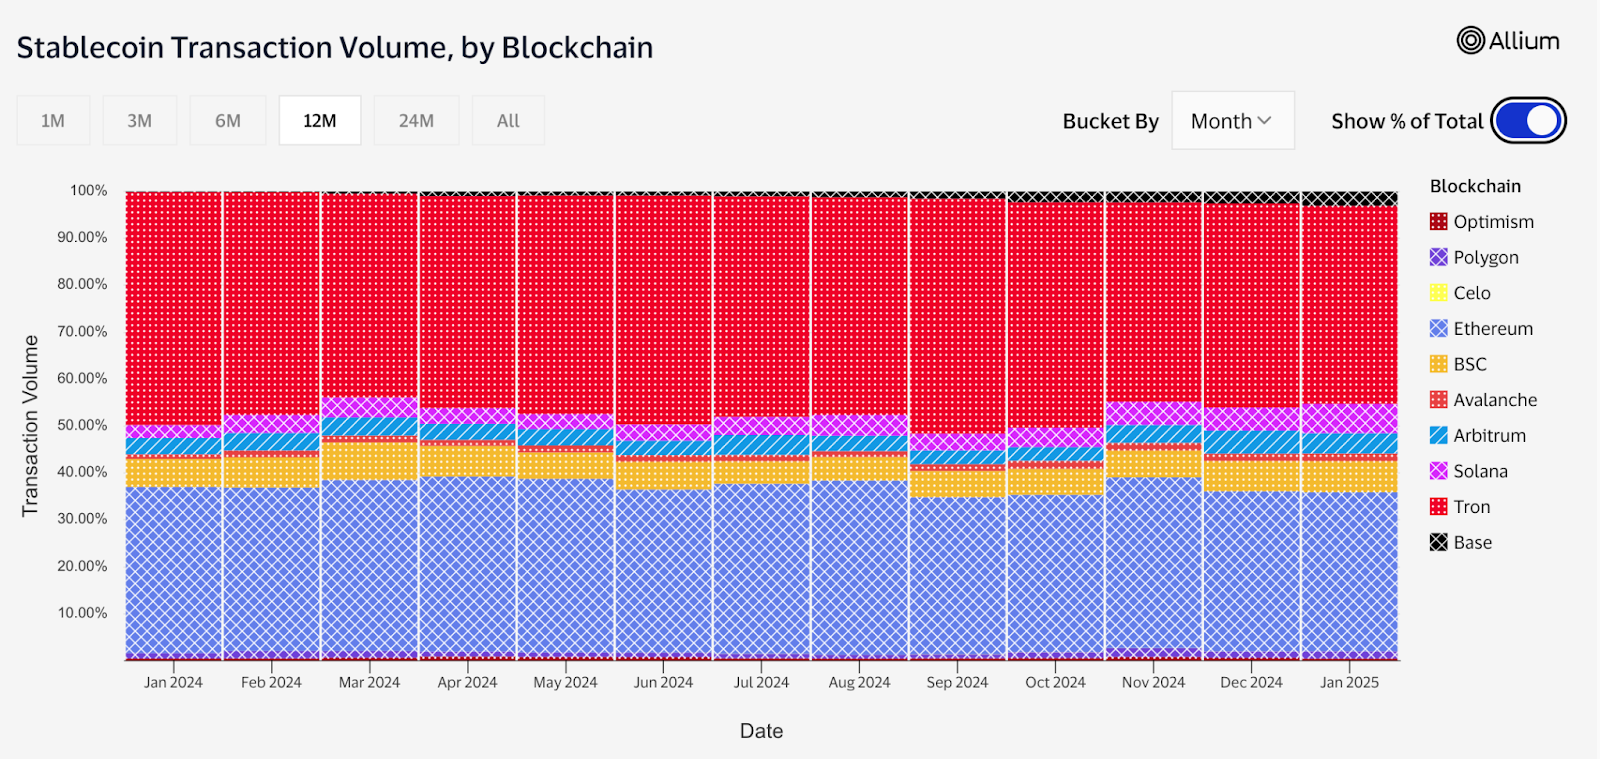
Ethereum and Tron continued to dominate as the primary networks hosting stablecoins, together accounting for over 83% of the market by the end of 2024. However, their combined share fell from 90% at the beginning of the year, highlighting the ongoing diversification of stablecoin adoption across other networks, particularly to Solana, Arbitrum, Base, and Aptos. This shift was particularly pronounced for Tron, which saw its market share decline significantly from 38% to 29%.
Chart: Stablecoin Market Cap Distribution by Network
Dominant Networks
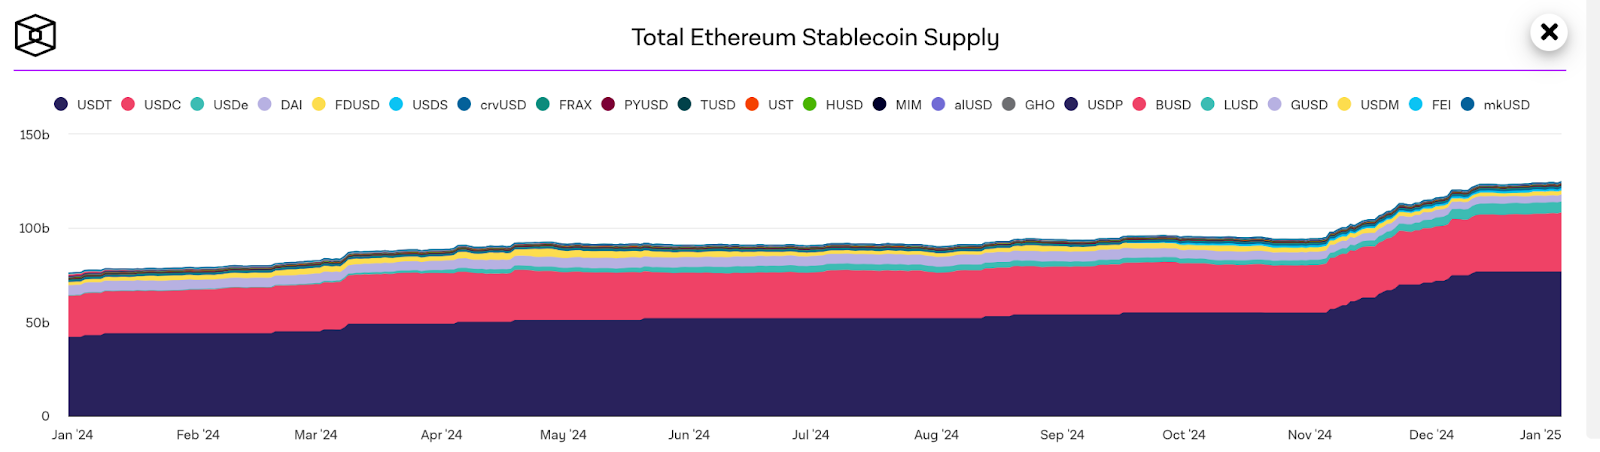
Ethereum’s stablecoin market cap grew by 65% in 2024, reaching a new all-time high. This growth was partly driven by a significant reduction in transaction fees following the Dencun upgrade in March, which enhanced Ethereum’s competitiveness as a stablecoin hub. In turn, post-election optimism surrounding the development of the DeFi space under the new U.S. administration provided further momentum for Ethereum’s stablecoin supply expansion.
Within the Ethereum network, USDT strengthened its dominance, increasing its share from 55% to 62%, while USDC’s share decreased from 29% to 25%. This shift primarily occurred amid Tether’s aggressive minting in Q4 and supply redistribution from other networks, primarily Tron, to satisfy increased demand.
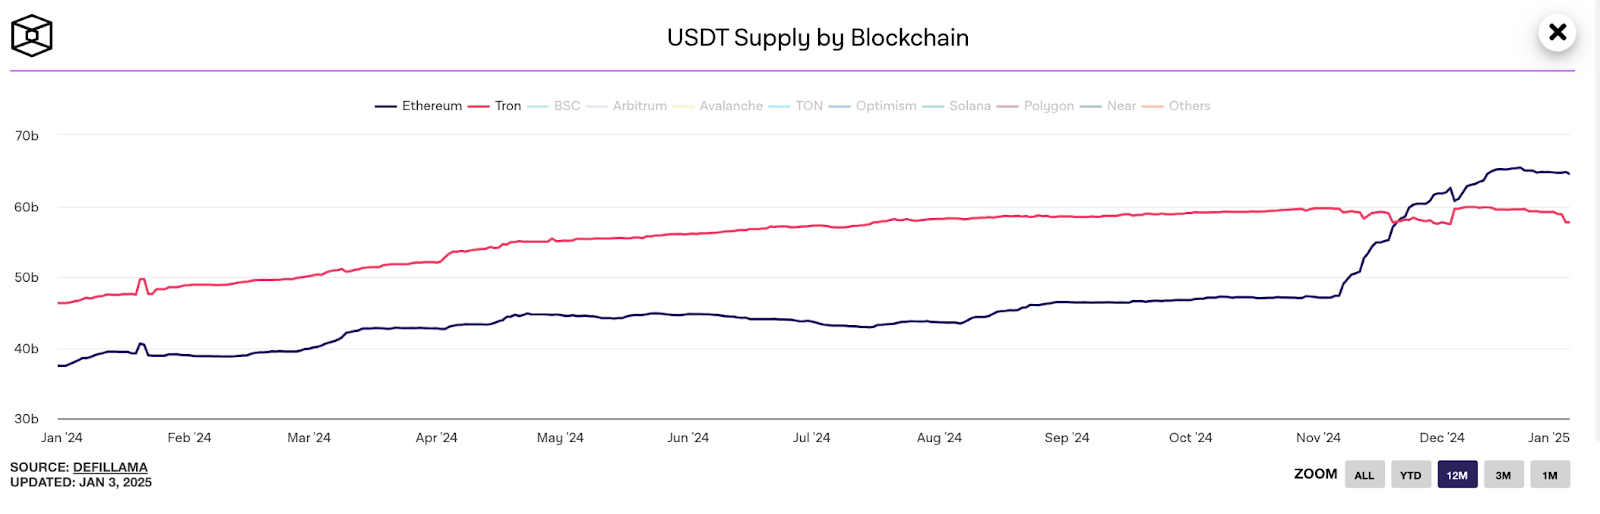
As a result, the surge in USDT supply was so substantial that Ethereum reclaimed its position as the largest network hosting USDT. This transition is particularly important as USDT accounts for over 98% of the entire stablecoin supply on the Tron network.
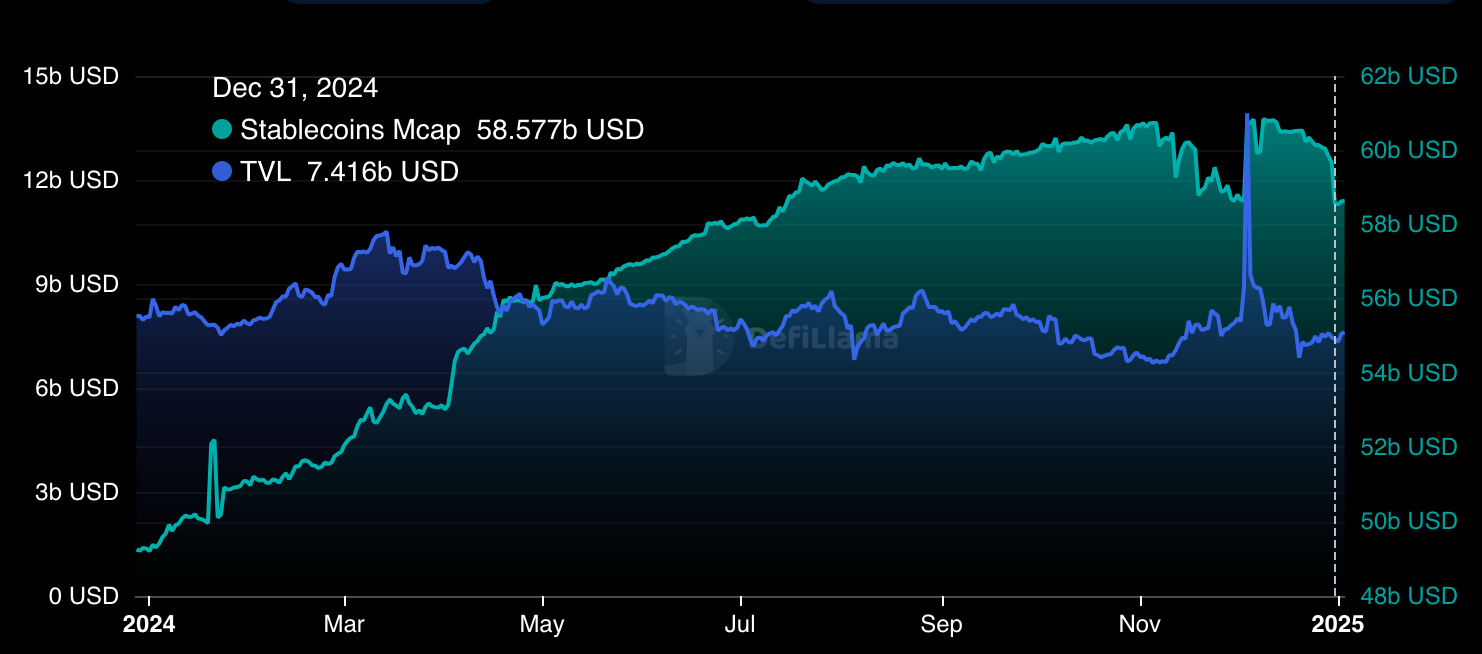
Compared to Ethereum, Tron experienced slower growth, with its stablecoin market cap increasing by only 19% in 2024. This is because Ethereum’s reduced transaction fees partly undercut Tron’s traditional cost-efficiency advantage. Moreover, Tron’s stagnant DeFi ecosystem, evidenced by an 8% decline in TVL during the year, further limited its growth potential.
Chart: Tron’s Stablecoin and TVL Dynamics in 2024
L2 Networks
Ethereum’s Layer-2 (L2) networks became significant beneficiaries of stablecoin expansion in 2024, with their combined stablecoin market cap growing by over 218%. The Dencun upgrade played a key role by drastically reducing transaction fees on L2 networks, with some protocols experiencing cost reductions of up to 99%. This made L2 networks increasingly attractive to Ethereum users to conduct transactions and utilize decentralized applications (dApps).
Among these networks, Arbitrum remained the one with the largest stablecoin supply. However, its share in total L2 stablecoin supply decreased from 65% to 55% due to the rapid rise of Base and the launch of new L2 networks. Base, in particular, saw substantial growth starting in March, fueled by memecoin hype and accelerated DeFi development within the network. Other catalysts included Coinbase’s transition of customer USDC balance to Base, as well the introduction of gasless transactions on Base.
Chart: L2 Stablecoin Market Cap Dynamics in 2024
Other Networks
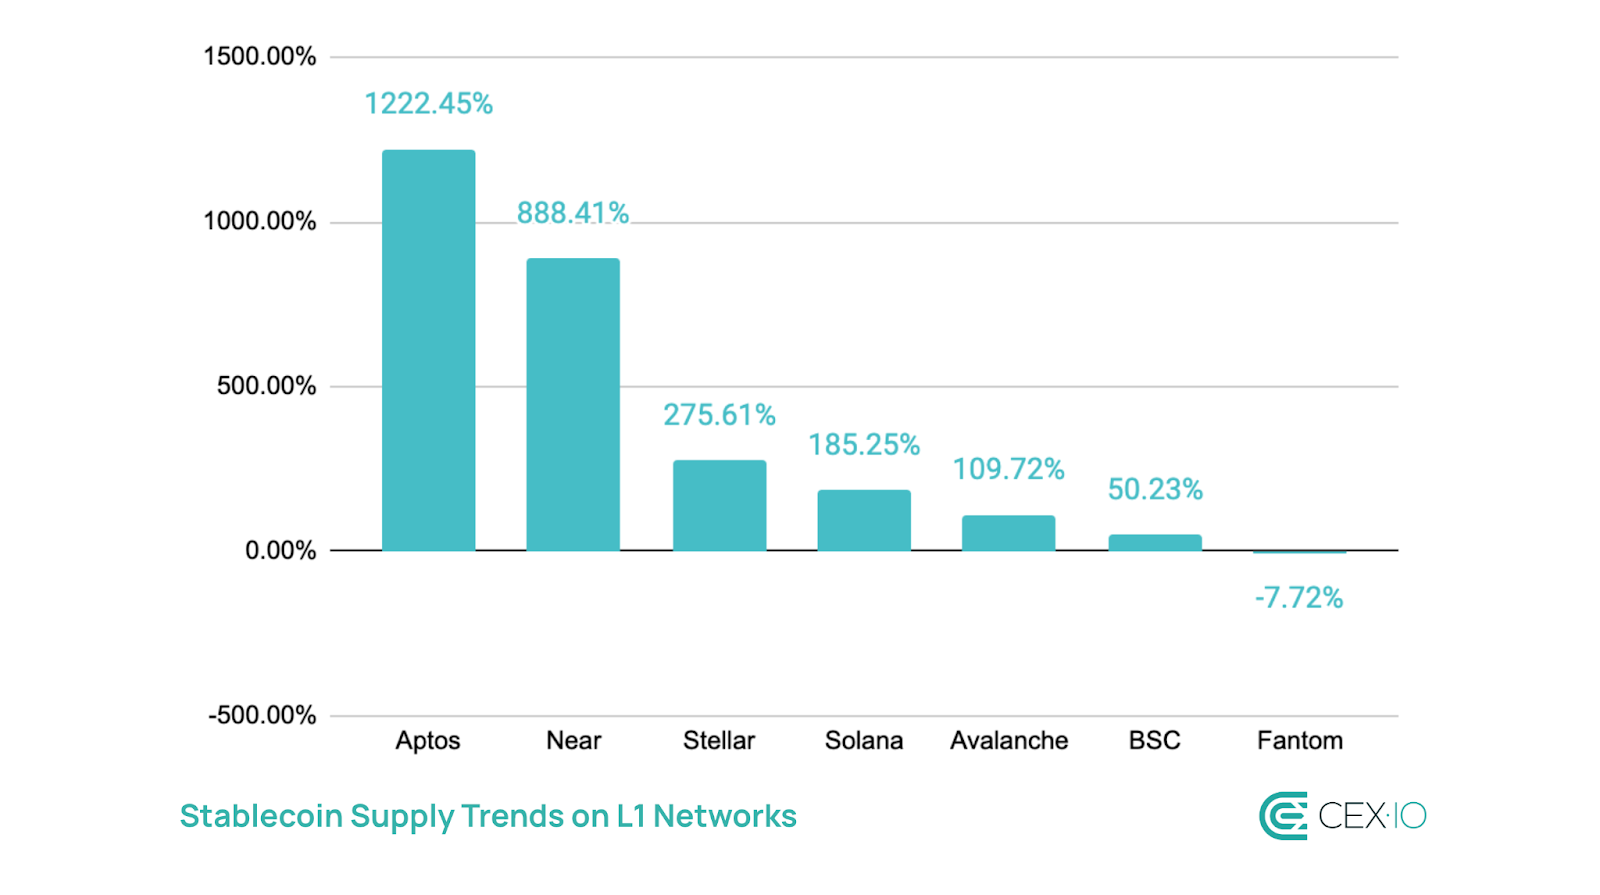
Among L1 networks hosting over $100 million in stablecoins, Aptos turned out a standout performer with a four-digit percentage increase in hosted stablecoin market cap. This growth was primarily driven by a massive increase of USDT supply, especially in the fourth quarter. At the start of 2024, USDT represented only 24% of Aptos’ stablecoin supply, but by year’s end, its share had surged to 70%, displacing USDC’s dominance within the network.
In contrast, Solana saw its stablecoin growth primarily driven by USDC, whose share rose from 53% to 74%. This increase aligned with Solana’s overall ecosystem growth, as stablecoins on the network were predominantly used for DeFi and other dApp activities.
Meanwhile, TON emerged as a notable newcomer in stablecoin adoption. Its stablecoin market cap surged to $1.2 billion following the adoption of USDT in June, with USDT remaining the only stablecoin on the network.
Transaction Volume
Total Transaction Volume
In 2024, total stablecoin transfer reached $27.6 trillion, surpassing a combined transaction volume of Visa and Mastercard over the same period by 7.68%. Notably, stablecoins have been exceeding traditional payment providers throughout the entire year, despite a significant drop in Q3 amid decreased activity on the wider crypto market.
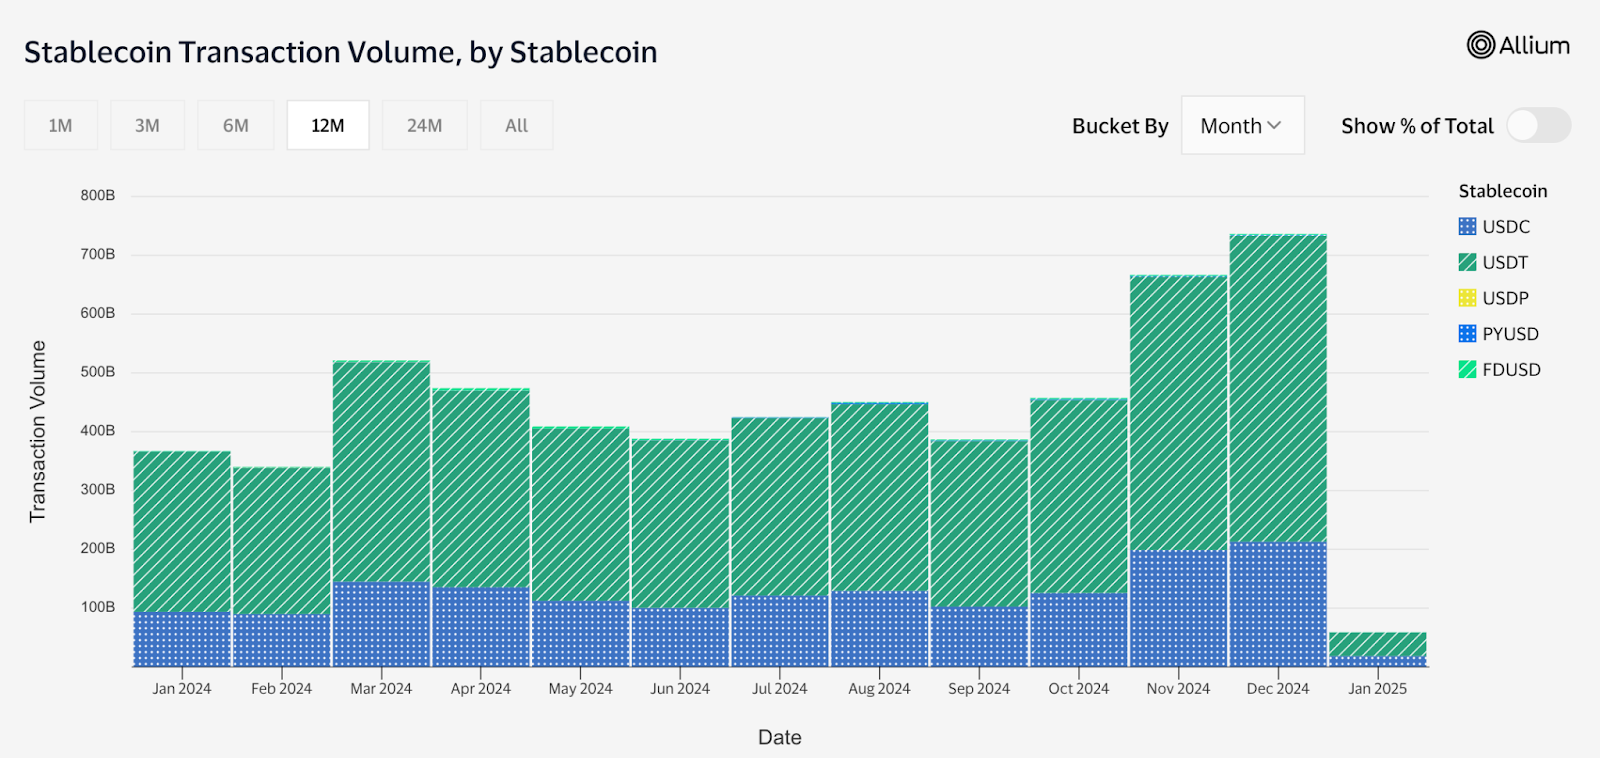
USDC reinforced its position as the preferred stablecoin for on-chain activity, accounting for 70% of the total combined transfer volume. Despite dominating raw transaction volume throughout the year, USDC’s influence waned slightly in Q3 due to a temporary decline in dApp activity. USDT also saw a substantial rise, with its total transfer volume more than doubling; however, its market share fell from 43% to 25%.
Chart: Total Transfer Volume by Stablecoin
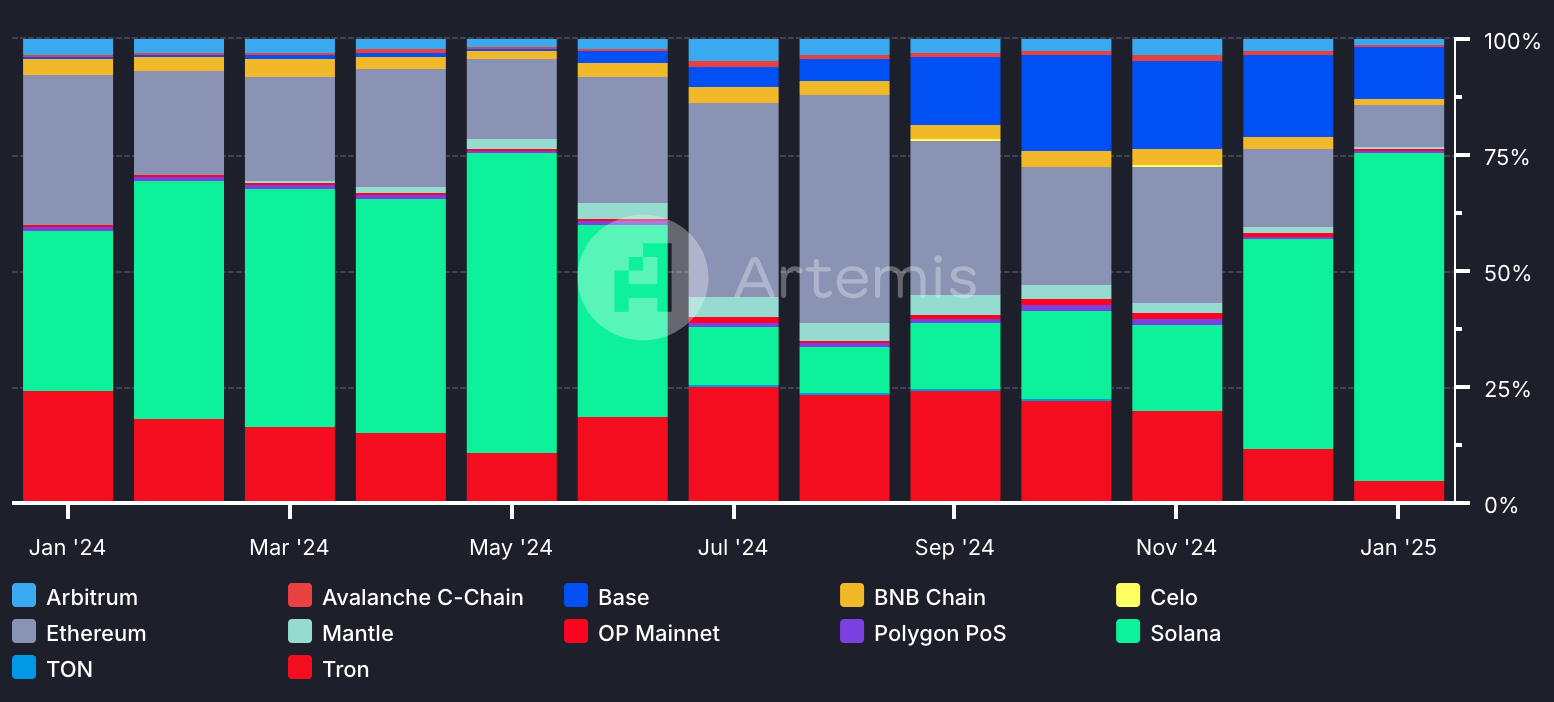
Starting in January 2024, Solana surpassed both Tron and Ethereum to become the most active network for stablecoin operations. This surge in activity positioned Solana as the primary driver of USDC’s market share growth, with total USDC transactions strongly correlated to Solana-based activity. USDC accounts for over 73% of Solana’s stablecoin supply.
Chart: Total Stablecoin Transfer Volume Distribution by Network
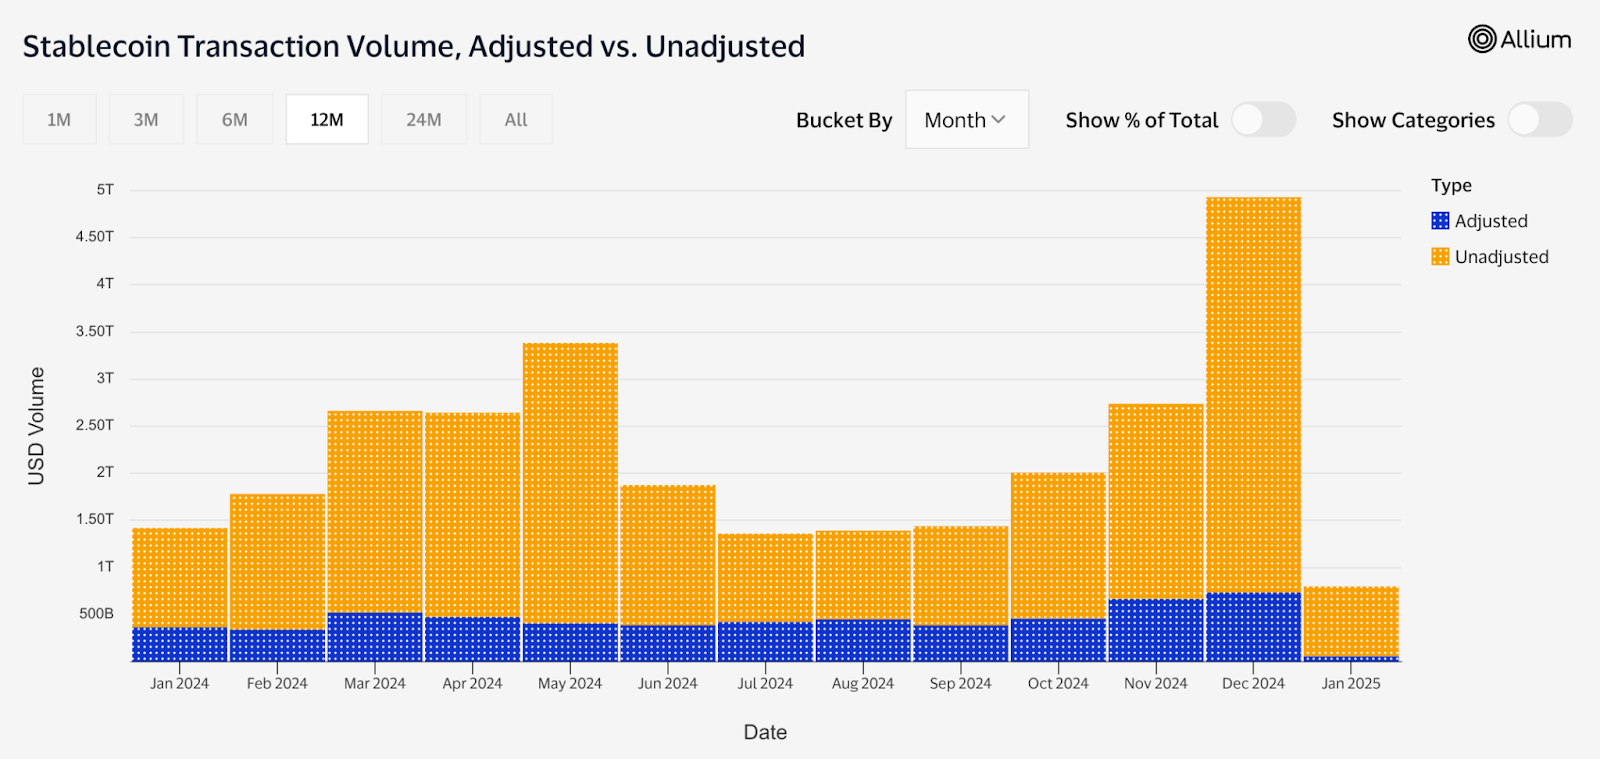
Adjusted vs. Unadjusted Transaction Volume
Now let’s distinguish between total and adjusted volume that excludes bot activity, internal smart contract transactions, and internal exchange transfers. On average, 77% of 2024’s total stablecoin transaction volume fell into the unadjusted category, largely driven by bot transactions. The bot activity experienced a fourfold increase compared to 2023, increasing its share from 80% to 90% in the unadjusted category. This means that 70% of stablecoin transaction volume in 2024 was related to bot transfers.
USDC dominated the unadjusted category, making up over 65% of the volume. This underscores the fact that much of USDC’s transaction activity was driven by bots.
Chart: Unadjusted Transaction Volume by Stablecoin
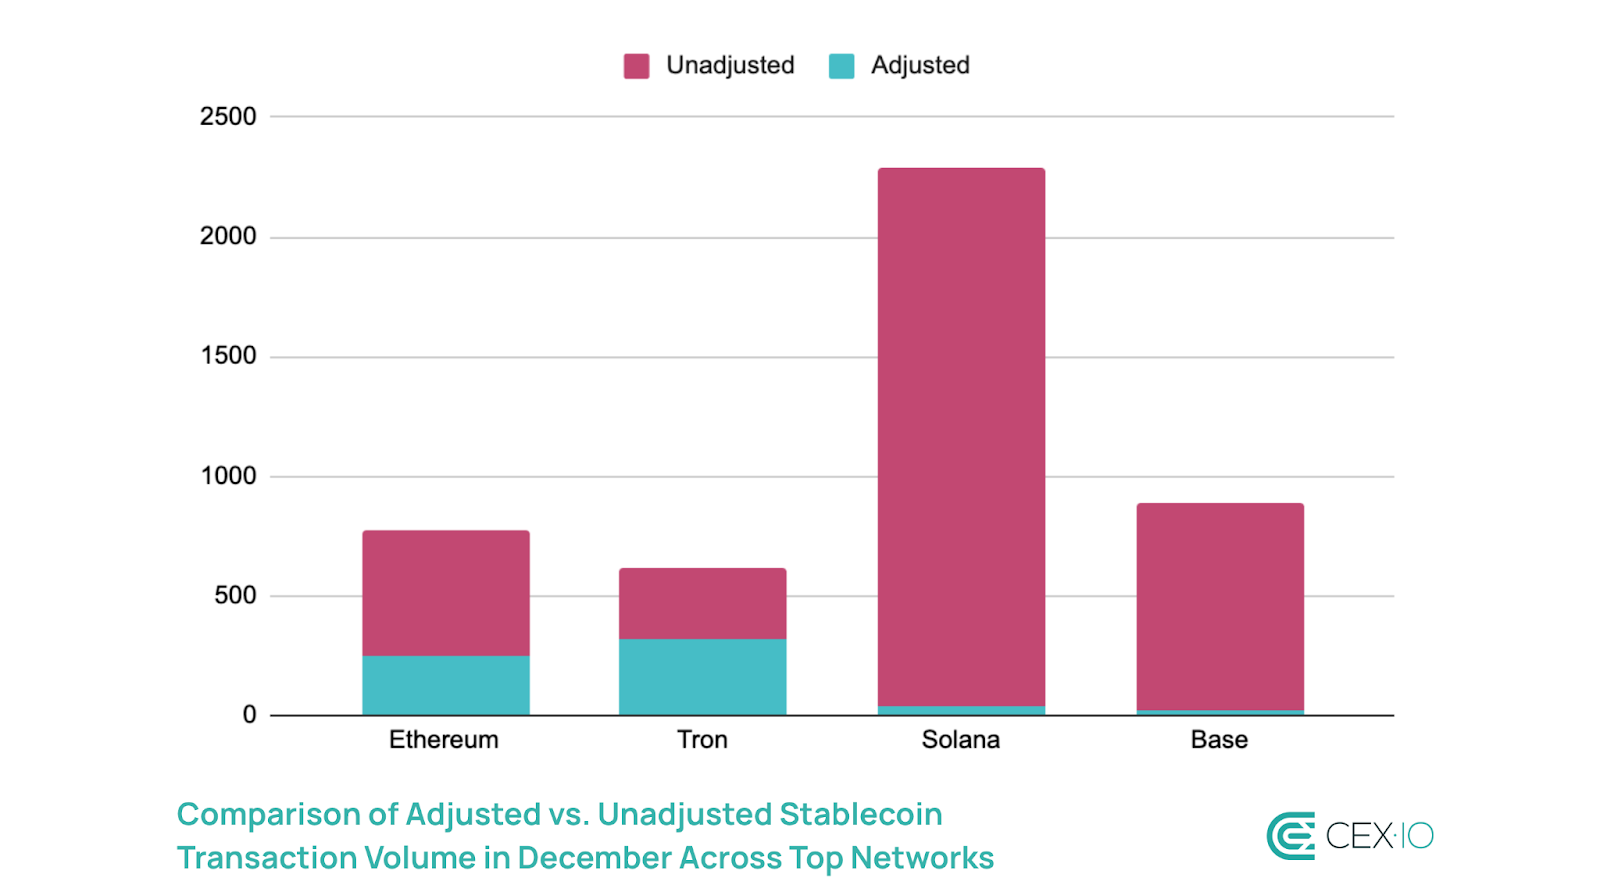
Networks such as Solana and Base, where USDC supply dominates, saw unadjusted transactions represent over 98% of stablecoin activity as of December 2024. Due to the bot activity, Base even managed to surpass Ethereum in total stablecoin transaction volume in Q4 2024.
Aside from general attributes like high transaction speed and low transaction costs that are essential for a productive bot environment, the rapidly rising DeFi ecosystem and the frequent launch of meme tokens provided fertile ground for bots on Solana and Base. For instance, in December, memecoins accounted for over 56% of DEX trading volume on Solana.
However, it’s important to point out that high bot activity within the network doesn’t necessarily mean “worse” transfer volume. While bots can be used for harmful practices like frontrunning, sandwich attacks, pump and dump schemes, and snipping liquidity pools, they also improve market efficiency through arbitrage. In addition, bots are used by paymasters to cover gas fees on behalf of users, smart contracts to execute recurring transactions, and aggregators to deliver deeper liquidity. As a result, bot dominance in stablecoin transactions could also represent the maturation of certain networks.
Adjusted Transaction Volume
If removing the bot activity from the equation and focusing on adjusted volume, which captures transfers to centralized exchanges (CEXs), decentralized exchanges (DEXs), and DeFi operations, the stablecoin transaction landscape will be completely different. Adjusted stablecoin transfer volume doubled in 2024, though it still lagged behind the growth of bot-driven activity.
USDT emerged as the dominant stablecoin for “organic” transactions, accounting for over 68% of adjusted transaction volume. In turn, PYUSD showed the highest adoption growth, tripling its share within adjusted transactions, though it still represented less than 2% of “organic” transaction activity.
In this category, Tron and Ethereum reclaimed their status as the leading networks for stablecoin transactions. Solana’s share of adjusted volume remained below 5%, despite doubling over the year. Meanwhile, Base experienced rapid growth in the second half of the year, becoming the sixth-largest network for “organic” stablecoin activity.
The rapid rise of Base and the increased presence of smaller networks indicate a broader expansion of stablecoin influence across the industry, with smaller platforms gaining traction for “organic” transaction activities. As such, Base became the best performing network in terms of “organic” growth, experiencing a four-digit increase in 2024.
Trading Volume
Total Volume
Stablecoins registered over $25.8 trillion in aggregated trading volume in 2024, continuing to gain market share over fiat, and solidifying their position as the preferred medium of exchange on trading platforms. The average daily trading volume among stablecoins soared by over 237% in a year, predominantly as a response to increased activity on wider crypto markets.
Despite increased trading volume, the weight of stablecoins compared to total crypto trading volume has been in decline throughout 2024. The primary reason was increased adoption of derivative products like perpetual swaps or futures that use cryptocurrencies as collateral, reducing the relative role of stablecoins in total trading volumes. Other catalysts behind decreased weight of stablecoins include rising demand on leverage and expansion of on-chain crypto-to-crypto trading without involving stablecoins, especially among memecoins.
Note: The “Total” value represents overall crypto trading volume, “Total 2” — excludes Bitcoin, while “Total 3” — excludes Bitcoin and Ethereum.
Volume Distribution
Despite the presence of hundreds of stablecoins, the market remains highly concentrated, with the top six most popular stablecoins contributing to approximately 99% of total trading volume. Among these, USDT maintained its lead as the most favored medium of exchange, accounting for a 79.7% of stablecoin trading volume on average.
In early 2024, USDT’s market share on CEXs has been trending downwards, declining from 81% to 66%. This decrease can be partly attributed to growing competition from stablecoins like FDUSD and USDC. The former benefited from Binance’s zero-fee promotions, while USDC increase signaled growing presence of regulated alternatives.
However, in the second half of 2024, USDT dominance in trading volume has been strengthening amid increased exchange reserves. According to CryptoQuant data, exchange reserves of Ethereum-based USDT surged by over 165% in a year, contributing to its share increase from 75% to 90% in total stablecoin exchange reserves.
2025 Outlook
As 2024 trends show, stablecoins strengthened their infrastructural role within the crypto industry, acting as a fuel for DeFi adoption and increased crypto trading activity. Building on this expansion, the sector is well-positioned for further increase in 2025, as post-halving years are typically marked by increased trading volumes.
The previous cycle, which became a turning point for the widespread adoption of stablecoins, indicates that their supply is likely to grow throughout much, if not all, of 2025, as capital rotation into stablecoins extended into the early bearish stages of the market. For example, stablecoin supply continued to increase until March 2022, five months after the market’s cyclical peak. Consequently, even if negative narratives hit the market, stablecoin demand may temporarily remain strong, benefiting from the trend.
During the post-halving year, the stablecoin supply increased at a relatively similar rate as a halving year, suggesting that it may reach $325 billion by the end of 2025 as a basis to support potential crypto market rally. The main variable for this year will likely be regulatory developments in the U.S. and other countries, which currently seems to be a potential amplifier that can boost stablecoin supply even further. Increased venture capital interest into stablecoin projects act as an additional catalyst that may help stablecoin supply reach the widely expected $400 billion market cap.
In addition to market cap expansion, post-halving years are also accompanied by heightened network activity. More than half of stablecoin supply is currently stored for less than a month, indicating high mobility of funds. Although the share of this high-mobile supply decreased from 58% to 51% in 2024, post-halving patterns suggest that stablecoin could be increasingly stored for shorter periods of time in 2025, primarily encouraged by higher on-chain trading activity.
Another trend likely to persist in 2025 is the expansion of stablecoins to non-dominant networks, primarily moving beyond Tron. The upcoming Pectra update, currently expected to launch on the mainnet in March 2025, promises scalability improvements and a more intuitive user experience with lower gas fees. These advancements could further solidify the position of Ethereum’s L1 and L2 networks as key hosts for stablecoin supply.
Meanwhile, Tron has been lagging behind Ethereum in implementing account abstraction and other user experience improvements, leaving cost-efficiency as its primary value proposition. However, as post-Dencun developments have shown, cost efficiency alone may not suffice to maintain Tron’s dominant position, as the network has been losing market share in both stablecoin supply and organic transfer volume.
Additionally, Tron’s significant reliance on USDT could pose challenges for the network. USDT’s share of the stablecoin market is already shrinking, even among fiat-backed stablecoins, and this trend is expected to continue in 2025, as the stablecoin may face headwinds due to potential regulatory disadvantages.
For instance, Tether didn’t manage to get an e-money license to operate in the EU, while Circle obtained it in July. In addition, USDC is the only stablecoin among the top six regulated under U.S. money transmitter frameworks, giving it a compliance advantage. This regulatory edge could drive increased USDC adoption in traditional payment systems and exchange trading throughout the year. Furthermore, lower-cap stablecoins are also expected to chip away at USDT’s dominance in 2025, with new TradFi-powered stablecoins set to launch and expand their market share.
In summary, 2025 is shaping up to be a more dynamic iteration of 2024, with familiar trends continuing to evolve at a faster pace, driven by increased market diversification and the widely anticipated crypto bull run.
The TRUMP token accounted for over 8% of the entire crypto market’s trading volume during Donald Trump’s inauguration.
Despite the cooled-off hype, Solana-based memecoins continue to dominate memecoin trading activity, potentially challenging long-standing patterns.
PolitiFi tokens reached 5% of the memecoin market cap and 21% of its trading volume, with the TRUMP memecoin accounting for 90% of the sector.
According to DeFiLlama’s Narrative Tracker, PolitiFi tokens and Solana (SOL) were the biggest winners in January, leading in category performance. The main catalysts behind this surge were Donald Trump’s inauguration and the launch of the official TRUMP token on Solana. At its peak, TRUMP temporarily accounted for over 8% of the entire crypto market’s trading volume, briefly pushing the total memecoin market cap above $115 billion.
The Post-TRUMP Cooldown
However, despite the continued creation of over 60,000 new memecoins daily on Pump.fun, the sector has largely cooled off following the TRUMP frenzy. Since Trump’s inauguration on January 20, the memecoin market cap has declined by 12%, while trading volume has dropped by over 80%.
Memecoins now represent less than 3% of the total crypto market cap — below post-election levels. Meanwhile, trading volume on Solana DEXes, which were key drivers of the latest memecoin surge, has returned to pre-TRUMP launch levels.
TRUMP’s Impact on Memecoin Volume Distribution
While the mid-January hype may have faded, it reshaped the memecoin landscape. In previous cycles, top-ranking memecoins by volume and market cap were dominated by Dogecoin and various Ethereum-based tokens. In 2024, however, the memecoin boom expanded to other networks, with Solana occasionally leading the sector in trading volume during local frenzies. Historically, though, after these hype-driven spikes, Dogecoin and Ethereum-based tokens have typically reclaimed dominance as trading volume rotated back to more established memecoins.
However, the TRUMP token may have disrupted this pattern. During Trump’s inauguration, TRUMP and MELANIA together accounted for 67.8% of total memecoin trading volume, significantly driving Solana-based memecoin activity. Notably, this surge in volume share was partly fueled by capital rotation from other memecoins, as several tokens, including DOGE, SHIB, and PEPE, experienced double-digit declines amid the TRUMP token’s launch.
Since then, trading volume has gradually rotated back toward memecoins like DOGE and PEPE, suggesting that previous leaders are reclaiming their top spots. Yet, as of February 1, Solana still dominates memecoin trading volume, with TRUMP maintaining the top position, accounting for 20% of total memecoin volume and 42% of Solana’s memecoin activity.
This raises two possibilities: either TRUMP is a game-changer, solidifying Solana’s position as the leading network for memecoin trading this year, or TRUMP’s volume still has room to decline, potentially dragging down the entire category of Solana-based memecoins due to its weight.
TRUMP’s Influence on the PolitiFi Sector
The TRUMP token has also transformed the PolitiFi sector, instantly becoming its dominant asset. It now represents 89% of both PolitiFi’s total market cap and trading volume.
Chart: Market Cap Breakdown in the PolitiFi Sector
With TRUMP in the mix, political memecoins have significantly increased their influence within the sector, now accounting for 5% of the memecoin market cap and 21% of its trading volume. This marks a 14x and 24x increase in market cap and volume, respectively, over the past two months. However, previous spikes in PolitiFi dominance have been short-lived, suggesting the sector could lose its momentum just as quickly as it gained it.
Conclusion
The launch of the TRUMP token has had a profound impact on the memecoin market, reshaping sector dynamics and challenging the long-standing dominance of Dogecoin and Ethereum-based memecoins. While the initial hype has subsided, the TRUMP token significantly influenced Solana’s increasing role in memecoin trading and the growth of the PolitiFi sector. This doesn’t necessarily indicate the complete shift in market trends, since they are historically short-lived, but can better position Solana in further potential memecoin frenzies.
The crypto AI sector surged by over 395% since November 2023, but it still accounts for just 1.5% of the total crypto market cap.
AI infrastructure projects historically dominated the sector, but their share drastically declined in a year as AI memes and AI agents gained significant traction, showing over 1,100% and 180% market cap increases, respectively.
The average daily trading volume for AI tokens increased by 93% year-over-year, though it has dropped 44% from its December 2024 peak.
AI agent tokens outperformed AI infrastructure tokens by trading volume, and, despite the recent sharp decline, they continue to dominate trading volume within the sector.
AI tokens underperformed relative to their size, lagging behind much larger AI-related stocks, especially over the past year.
AI tokens maintain a positive correlation with Big Tech stocks, with Meta (0.91) and Nvidia (0.84) showing the highest, but earnings releases like Nvidia’s showed an inverse correlation.
Introduction
“The reason it is so hard for so many humans to understand crypto assets is because these assets are not for us. They are being built for the machines.” This six-year-old quote resonates deeply with today’s crypto landscape.
On one side, the crypto industry has embraced automation, with the rise of on-chain smart contract utilities and bots playing a growing role in network efficiency. However, digital assets have struggled to establish a widespread presence within the broader AI revolution. While AI advancements from Big Tech giants have fueled investor enthusiasm, the crypto AI sector remains structurally underdeveloped and highly speculative.
In this report, we’ll explore the changing landscape of the crypto AI sector and its relationship with mainstream AI innovation.
Methodology
The analysis in this report is based on data sourced from CoinMarketCap, CoinGecko, TradingView, and Dune. The market cap and volume trends of AI-related digital assets were compared against broader crypto market movements to assess sector-specific shifts. Due to the non-established categorization of AI tokens, the report offers its own sector distribution divided between AI infrastructure, AI agents, and AI-themed memecoins. Additionally, price correlations with leading AI-focused stocks were examined to determine the influence of external AI advancements.
Market Cap Trends
Total Market Cap
The total market cap of the crypto AI sector has seen a massive surge starting November 2023, jumping by over 395% and driven by growing AI optimism. The sector has largely mirrored the broader crypto market, experiencing two significant rallies in Q1 and Q4 2024:
The second rally saw a shift in market dynamics, with AI memes gaining even more traction, while AI agents surged alongside rapid adoption of the Virtuals.io platform.
Despite these surges, the sector’s market cap currently remains 56% below its December 2024 peak due to the DeepSeek R1 release and a broader market cooldown.
Throughout the past year, AI-related assets have maintained a relatively small footprint within the crypto market, accounting for around 1.5% of the total crypto market cap. This suggests that while the sector has grown significantly, its gains have mostly been in line with the wider market. However, its share within the altcoin market has slightly improved, rising from 3.14% in January 2024 to 3.58% in January 2025.
Note: The “Total” value represents the overall crypto market cap, “Total 2” — excludes Bitcoin, while “Total 3” — excludes Bitcoin and Ethereum.
Market Cap Distribution by Category
The classification of AI crypto projects remains an evolving process, with debates over naming conventions and categorization criteria. For instance, many AI-related categories on CoinGecko were only established a few months ago, and many projects overlap across multiple categories. In this case, let’s focus on three major categories that have existed for at least a year:
AI Infrastructure – Projects like Near, Render, and Bittensor, which provide the computing and blockchain layers necessary for AI to function on-chain.
AI Agents – AI-driven models that can interact online in real-time, along with platforms enabling their creation and deployment.
AI Memes – Speculative AI-themed tokens, often driven by hype rather than underlying technology.
Historically, AI infrastructure has dominated the sector, accounting for over 86% of the crypto AI market cap in February 2024. However, 2024 marked a shift toward speculative AI narratives, with AI agents doubling their market share and AI memes skyrocketing their share by over 15x.
This shift stems from AI infrastructure’s stagnant performance, and suggests that either the market doubts the long-term value of infrastructure projects, or these projects require more time for widespread utility. Meanwhile, the demand for fresh, high-momentum narratives has propelled AI agents and memes to the forefront.
Notably, a surge in AI agents and memes is closely linked. The AI agent category saw a major boost in Q4 2024, driven by the launch of the first online AI influencer on the Virtuals Protocol platform (e.g., Luna). In turn, AI memes gained momentum, largely fueled by the Terminal of Truth AI agent/chatbot, which became widely known for shilling Goetius Maximus (GOAT) memecoin on social media.
Note: Performance as of February 25, 2025
Market Cap Changes by Asset
On an individual token level, established infrastructure projects continue to hold the largest market caps, with eight still above $1 billion despite the sector’s recent pullback. In contrast, only one AI agent token (FET) currently exceeds $1 billion, and no AI meme tokens surpass $500 million.
That said, market leadership within AI infrastructure is shifting. ICP and The Graph (GRT) have lost ground in the sector’s market cap rankings. Bittensor (TAO) and Render (RENDER) have gained share, reinforcing their position as key infrastructure players.
Although infrastructure projects have a significant margin of safety, AI agents are getting closer to the top positions in market cap. Since December 2024, AI agent launchpad platforms such as Virtuals Protocol (VIRTUAL), Griffain (GRIFFAIN), and AI Rig Complex (ARC) have notably increased their market presence.
Note: The breakdown includes a combination of AI infrastructure (NEAR, ICP, TAO, RENDER, GRT) and AI agent tokens (FET, VIRTUAL, AI16Z, ARC, GRIFFAIN).
Virtuals Protocol has been the main driver of the sector’s move toward AI agents, with tokens launched on this platform surging from nearly zero to over $3.5 billion in market cap within three months. However, the hype quickly faded, leading to an 87% decline from its peak, suggesting that this may be more of a speculative play than a lasting technological advancement.
This market cap decrease was accompanied by a substantial drop in daily AI agent launches on Virtuals, from over 1,000 in November to less than 10 in February. At the time of this writing, only 2.2% of these AI tokens have graduated, or accumulated 42,000 VIRTUAL tokens to get their own liquidity pool.
AIXBT dominates among Virtual-launched AI agents, accounting for over 45% of the combined market cap.
Volume Dynamics
Total Volume
The average daily volume of AI tokens saw a significant improvement, increasing by more than 93% since January 2024. However, this growth was undermined by a 41% decline in daily trading volume from the sector’s peak in December.
In December 2024, AI tokens reached an all-time high, with the top 10 assets in the sector registering over $100 billion in monthly trading volume. For comparison, this is equivalent to the entire memecoin trading volume on Solana DEXes that month.
While the sector’s overall market cap followed broader trends, trading activity among AI tokens intensified relative to its size. Over the past year, the AI sector’s share of total trading volume increased from 1.5% to 2.22%, with a significant portion of this increase occurring in the last three months.
Note: The “Total” value represents overall crypto trading volume, “Total 2” — excludes Bitcoin, while “Total 3” — excludes Bitcoin and Ethereum.
Volume-to-Market Cap Ratio
The uptick in trading activity suggests growing interest in AI tokens, but the Volume-to-Market Cap Ratio suggests that AI tokens are not attracting the same level of short-term hype-driven volume as general altcoins and memecoins. The fact that AI tokens aren’t experiencing the same trading frenzy could mean that the sector lacks the viral appeal needed to sustain momentum, making it harder for projects to capture retail attention and drive network effects.
Additionally, if AI tokens remain stuck in a middle ground — not as fundamentally strong as BTC/ETH but not as hyped as memecoins — they risk lagging in speculative market cycles, limiting their potential for explosive short-term gains.
Volume Distribution
Trading volume breakdown between assets also reveals an even more remarkable shift in favor of AI agents. In January 2025, top 5 AI agent tokens outperformed top 5 AI infrastructure ones by monthly trading volume. VIRTUAL played a pivotal role in this trend, briefly securing a 20% share of a combined volume.
Note: The breakdown includes a combination of AI infrastructure (NEAR, ICP, TAO, RENDER, GRT) and AI agent tokens (FET, VIRTUAL, AI16Z, ARC, GRIFFAIN).
The same month, the VIRTUAL token and AI agents launched on Virtual Protocol briefly madeup 28% of the total DEX volume on Base, Ethereum’s Layer 2 network. However, as the initial hype faded, their share shrank to just 8%, with total DEX volume for VIRTUAL dropping by 64% and Virtual-based AI agents plunging by 93%. Despite the sharp decline, AI agents continue to dominate trading volume within the sector.
Big Tech AI vs. Crypto AI
General Observations
While AI tokens are heavily influenced by broader crypto market trends and sector-specific developments, they also have a unique catalyst: breakthroughs in AI technology from top-tier IT corporations. Big Tech serves as a major reference point for crypto AI projects, shaping the overall AI narrative and indirectly driving interest in blockchain-based AI solutions.
Here are some key observations on how this dynamic plays out:
Mainstream AI breakthroughs don’t cause immediate crypto AI growth — While OpenAI’s ChatGPT launch and GPT-4o announcement boosted sentiment in AI tokens, their immediate impact on crypto AI was largely in line with the broader market. For example, after ChatGPT’s launch, the total crypto market cap saw a 12% increase over the next 7 days, while the crypto AI market cap increased by 10%. However, as ChatGPT saw massive adoption in the months following its launch, it provided a sustained boost to the sector.
The more attention AI narratives receive, the greater the volatility in crypto AI — Sam Altman’s temporary ouster from OpenAI and the release of DeepSeek both put AI in the spotlight, but with different immediate effects. Altman’s temporary ouster coincided with a 49% surge in crypto AI market cap. In contrast, DeepSeek’s release caused only a slight dip of 2%, but it led to notable volatility in the following weeks as the industry took time to assess its impact.
Big tech intersections with crypto AI typically cause notable market moves — For example, Elon Musk has long been an impactful figure in the crypto space, and when rumors of his AI initiative emerged in November 2023, followed by the official announcement, crypto AI saw a significant surge. The announcement of xAI and the Grok AI chatbot led to a 35% rise in the crypto AI market cap in a week.
Table: 7-Day Performance of Total Crypto Market Cap & AI Tokens After Key AI Events
AI Stock and Cryptocurrency Performance
Although AI crypto tokens are much smaller in market capitalization and more focused on AI-specific applications than some AI-related stocks, the sector hasn’t fully captured AI market momentum.
Top AI stocks like Nvidia (670%) and Palantir (1,109%) delivered massive gains since ChatGPT’s launch in November 2022. In contrast, the average performance among top AI crypto tokens (403%) over the same period was significantly lower. While some AI tokens, such as FET (954%) and RENDER (634%), saw impressive gains, the sector as a whole underperformed relative to its size.
Note: Performance as of February 25, 2025
When analyzing a shorter investment period, crypto AI tokens appear even more underwhelming. Over the past year, top AI tokens primarily remained in the red, significantly lagging behind Big Tech stocks. Additionally, while some AI stocks fully recovered from a DeepSeek-related sell-off, AI tokens remained largely underwater, failing to capture positive momentum.
Nevertheless, AI tokens continue to exhibit a high correlation with Big Tech stocks. As such, while Big Tech does not act as the primary driver of AI token performance, it serves as an amplifying catalyst. Among the observed stocks, Meta (0.91) and Nvidia (0.84) showed the highest correlation with AI tokens.
Table: Big Tech Stocks vs. AI Tokens Performance Since Key AI Events. Performance as of February 25, 2025
Nvidia Earnings Effect
Earnings season is one of the most anticipated regular events for stock investors, as financial reports often drive increased volatility. Given the high correlation between Big Tech and AI tokens, one might expect similar price action in AI tokens during these events, especially considering reports that Nvidia’s earnings previouslyboosted crypto AI performance.
However, when comparing Nvidia’s one-day and seven-day post-earnings performances with those of top AI crypto tokens, the correlation actually turned negative (-0.21 for 1D and -0.07 for 7D). While this effect smoothed out over a longer period, the event suggests that Big Tech developments may shift attention out of crypto AI.
Conclusion
Crypto AI remains a niche but evolving sector within the digital asset market. While its market cap has expanded significantly, its long-term growth remains uncertain, as trading volume is heavily driven by short-term speculation, with frequent but fleeting volume spikes rather than steady, organic growth. The rapid rise and fall of volume indicate that capital is not staying within the sector for extended periods, making it vulnerable to liquidity drains and price instability.
Despite its high correlation with AI stocks, crypto AI’s price movements often diverge from traditional AI market trends, suggesting that its momentum is fueled more by internal hype cycles than by fundamental AI advancements. The shift from infrastructure projects to AI agents and memes highlights changing market priorities, with speculative narratives gaining traction over foundational development.
Looking forward, the sector faces both opportunities and risks. If AI-driven blockchain solutions achieve real-world utility, they could secure a stronger foothold. However, without sustained investor confidence and clear technological advantages, crypto AI risks being overshadowed by both traditional AI innovation and more established crypto narratives.