
Pudgy Penguins (PENGU) price jumped 31% on July 13, following a viral post from TRON founder Justin Sun. He shared a cartoon image of a penguin character featuring his hairstyle and a TRON shirt. The caption read,
“OK. Everyone has become a penguin.”
This post spread quickly across social media. Pudgy Penguins’ official X account quoted Sun’s message and replied,

“Everyone will Huddle. Justin looks good here. Welcome to the Huddle.”
The engagement pushed Pudgy Penguins into wider discussions and fueled demand for the Solana-based meme coin.

The PENGU token became one of the top gainers on CoinGecko that day. On-chain activity and retail attention increased after Sun’s interaction, with PENGU price rising sharply.
Analyst Highlights Fundamentals and $0.060 Price Target
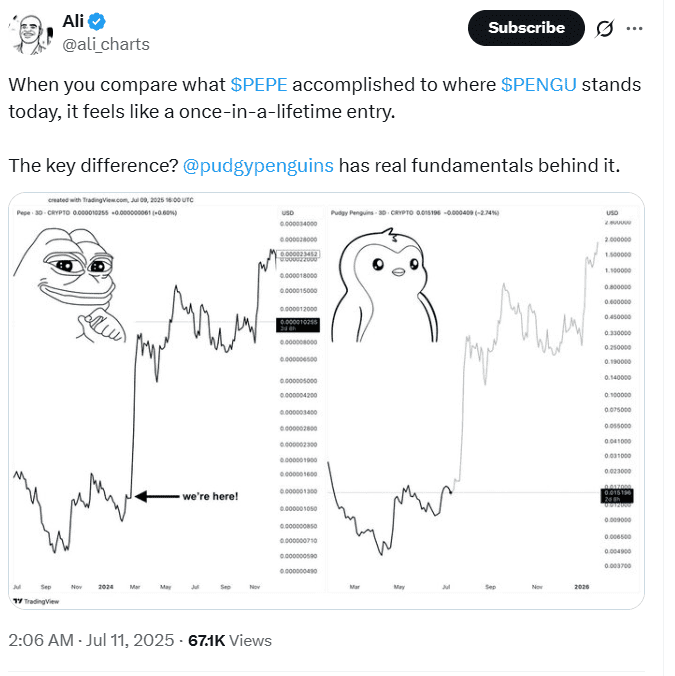
The PENGU price move came just days after on-chain analyst Ali noted strong momentum forming on the PENGU/USDT chart. He called it a “textbook bullish retest” and compared Pudgy Penguins to other meme coins, stating that the token showed solid fundamentals.
Ali set a short-term PENGU price target of $0.060 by August. He linked this outlook to the recent U.S. Securities and Exchange Commission (SEC) acknowledgment of the Canary Spot PENGU ETF filing.
The SEC filing was submitted a few days earlier. Following that acknowledgment, the PENGU price climbed more than 23% to reach a multi-month high.
Ali’s comments about the Pudgy Penguins token gained traction across multiple trading and analysis platforms. His post added to the growing interest in the Solana-based meme coin.
While Pudgy Penguins gained attention, Justin Sun also addressed TRON network fees. In a post shared shortly after the PENGU image, Sun confirmed that TRON had implemented new fee reductions.
He cited the impact of JustLend’s STRX staking feature, which reduced TRON energy rental prices by 30% across multiple use cases. Sun also called on the TRON community to continue adopting cost-saving measures.
These changes aim to maintain TRON’s position as a low-cost blockchain. The fee cut announcement coincided with Sun’s PENGU post, linking both token activity and infrastructure updates in a short timeframe.
TRON’s lower transaction fees and the attention around the PENGU token brought more visibility to both platforms during the weekend trading session. The Pudgy Penguins token remains active within the Solana-based meme coin sector, drawing ongoing interest from social and technical fronts.
PENGU Price Trades Inside an Ascending Channel on July 14 2025
The one-hour PENGU/USDT chart dated July 14 2025 shows the Pudgy Penguins token moving within an ascending channel—two parallel trend-lines that slope upward, marking a sequence of higher highs and higher lows. An ascending channel often signals sustained buyer control until either boundary breaks.
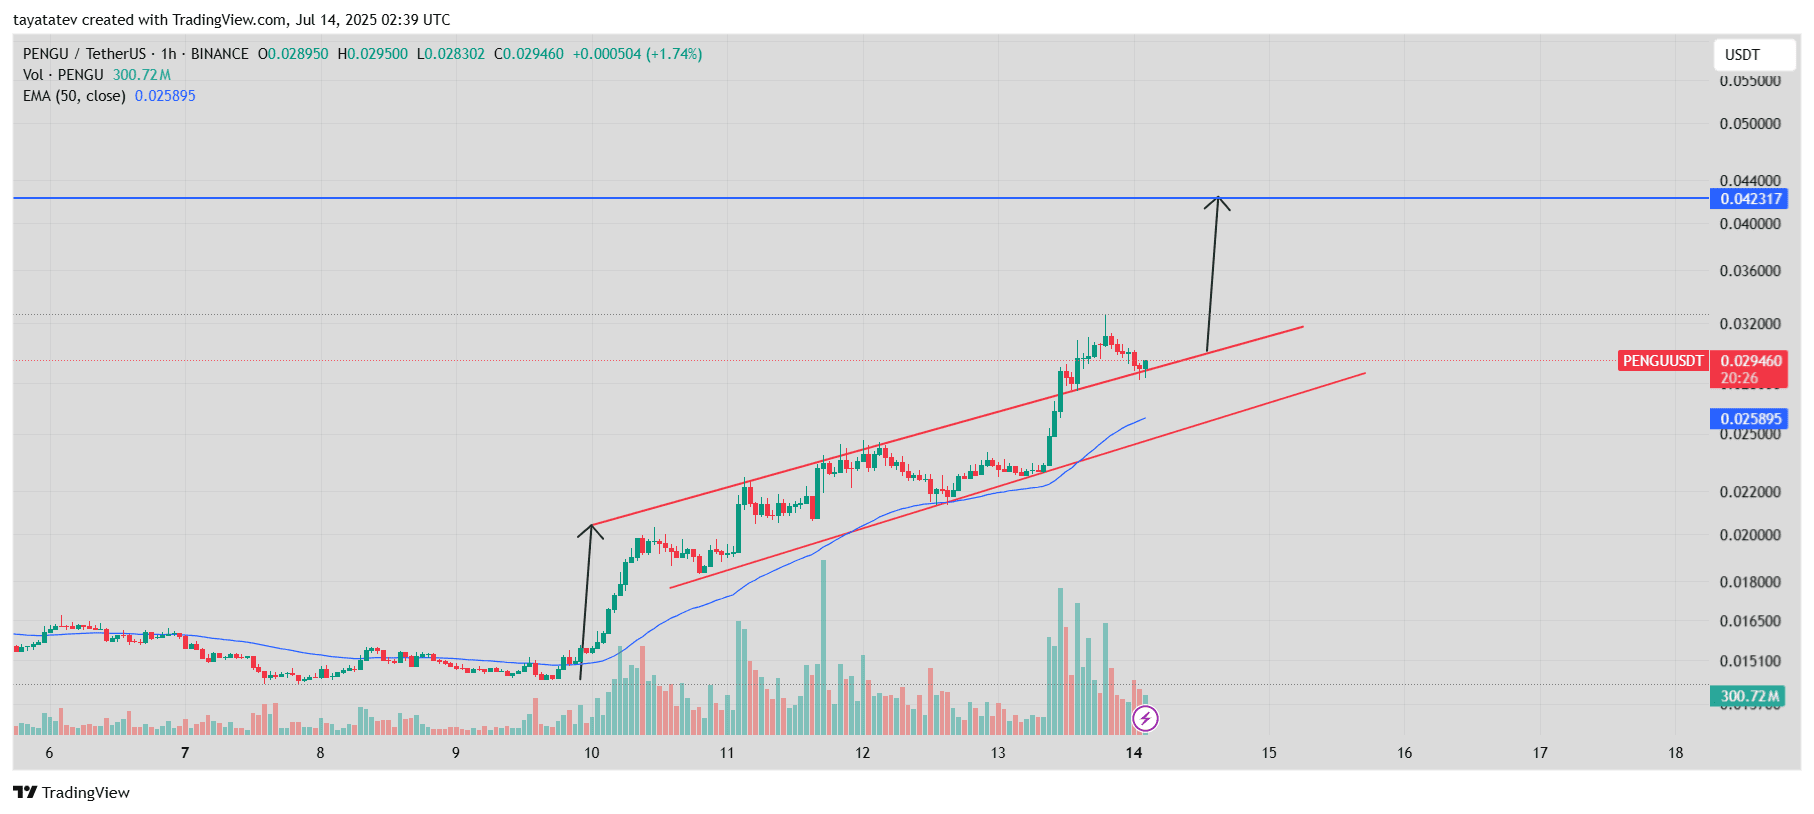
On July 10 the price burst above the channel’s mid-line, gaining about 19 percent before retreating. It now tests the channel’s lower rail near $0.02946, only marginally above the 50-period Exponential Moving Average (EMA), which stands at $0.02590. Volume has tapered after the surge, yet it remains elevated compared with early-July levels, showing ongoing market interest.
If the lower rail holds, the pattern’s upper boundary, projected to align with horizontal resistance at $0.0423, offers the next objective. A move from the current price to that level would equal roughly a 43 percent advance. Conversely, a close beneath the support line would weaken the bullish structure and could force a reassessment of near-term momentum.
MACD Shows Momentum Shift for Pudgy Penguins (PENGU) Token
The one-hour Moving Average Convergence Divergence (MACD) chart for PENGU/USDT dated July 14 2025 reveals a clear change in short-term momentum. Earlier on July 10, the blue MACD line crossed above the orange signal line, and the green histogram bars expanded. That crossover aligned with the 19 percent climb inside the ascending channel noted on the price chart.
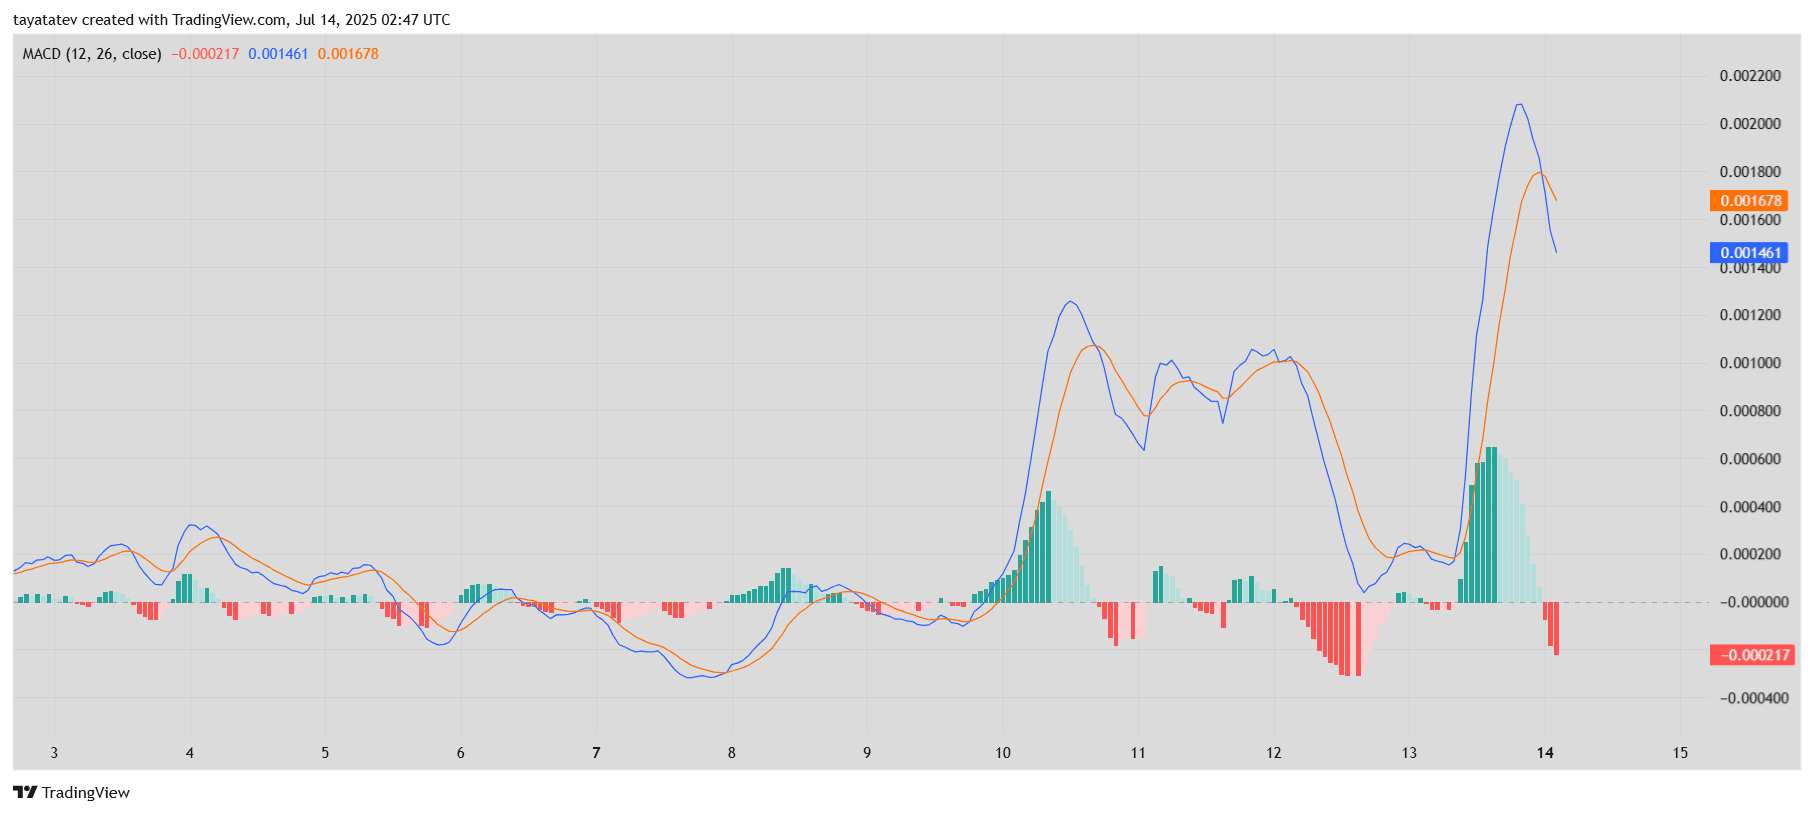
Next, on July 12, the histogram bars thinned, and the MACD line dipped toward the signal line. By early July 14, the MACD line slipped below the signal line, printing red histogram bars. A negative histogram shows that bearish momentum now outweighs bullish pressure in the one-hour window.
Meanwhile, the MACD values remain close to the zero baseline, sitting near 0.00146 for the MACD line and 0.00168 for the signal line at the time of the screenshot. When both lines hover near zero, the trend often lacks strong conviction. Traders therefore watch the next crossover or a fresh push away from the baseline to gauge whether Pudgy Penguins (PENGU token) resumes the earlier advance toward the $0.0423 channel target or settles into consolidation.
The indicator’s recent swing coincides with the PENGU price test of channel support and follows Justin Sun’s viral post, the SEC’s acknowledgment of the Canary Spot PENGU ETF, and continued discussion about TRON gas fees. Those events still keep the Solana-based meme coin prominent, yet the MACD now signals that immediate momentum has cooled.
RSI Cools Down After Overbought Spike on PENGU/USDT Chart
The Relative Strength Index (RSI) for PENGU/USDT, dated July 14, 2025, shows a clear retreat from overbought conditions. The RSI line peaked near 80 on July 13, a level that typically signals increased selling risk. Since then, the index dropped to 62.24, suggesting that bullish momentum has weakened but not reversed entirely.
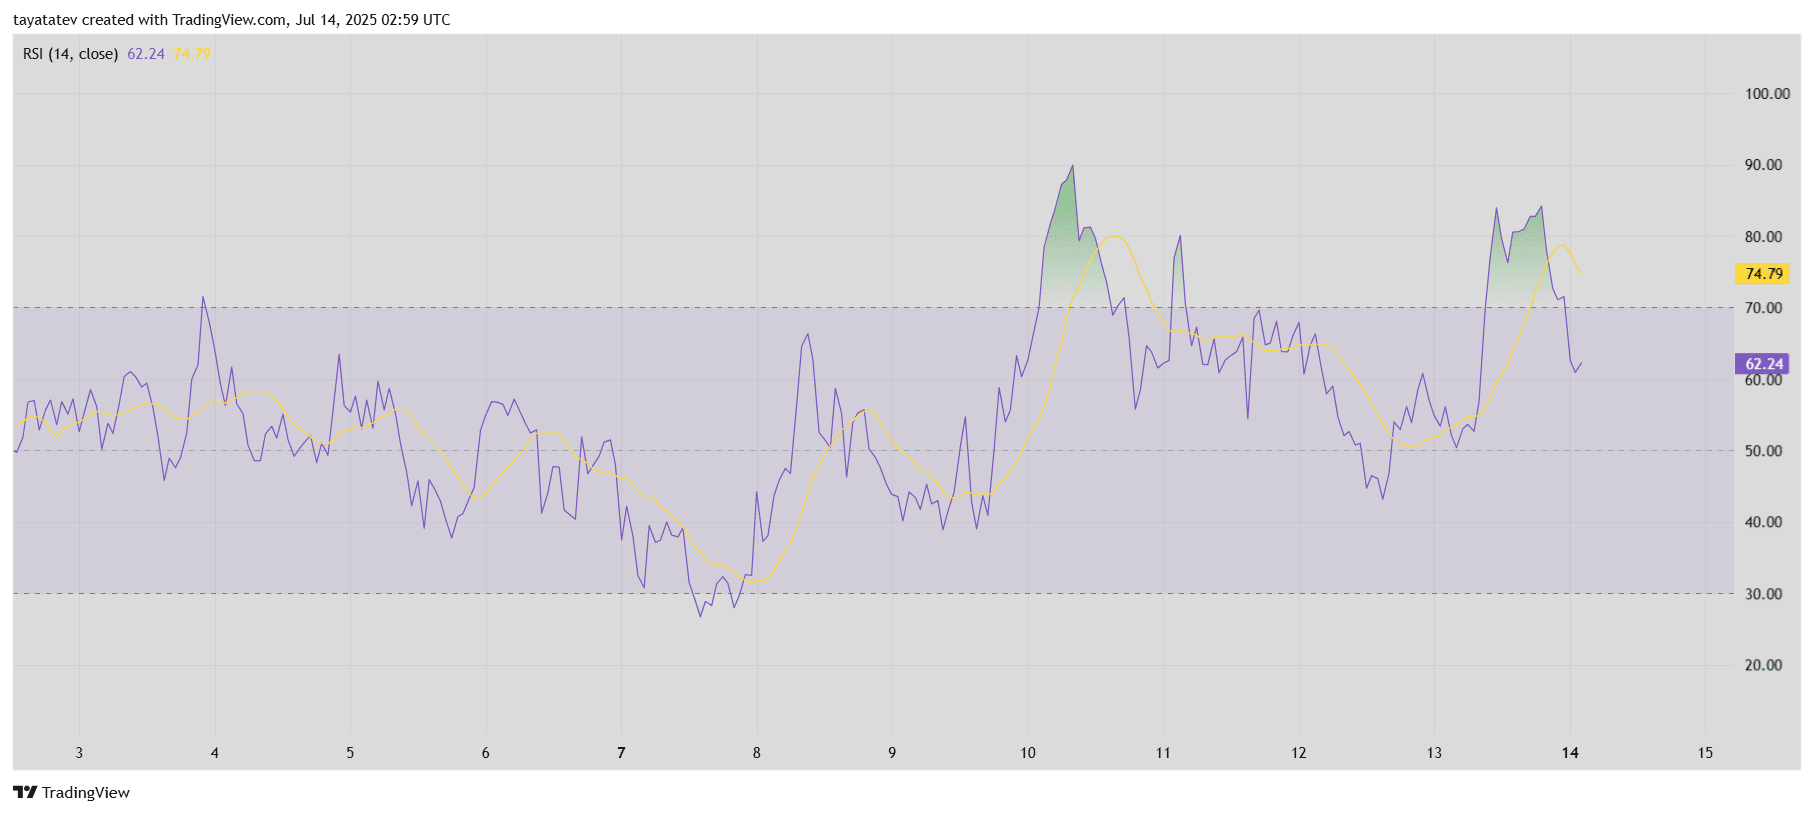
The 14-period RSI measures recent price gains versus losses. When values exceed 70, the asset is considered overbought. Below 30 indicates oversold. The yellow moving average of the RSI, currently at 74.79, crossed above the purple line briefly but now trends downward.
This drop follows the Pudgy Penguins (PENGU token) rally sparked by Justin Sun’s social media post and the SEC’s acknowledgment of the Canary Spot PENGU ETF. After the price jump, the RSI confirmed strong momentum, but the latest cooldown may indicate that traders started locking in profits.
Despite the pullback, RSI remains above neutral territory (50). This position suggests continued underlying interest in the Solana-based meme coin, although the earlier surge has paused. Traders will likely monitor whether RSI stabilizes above 60 or moves lower in the next sessions.